Adopting Thanos at LastPass
Our situation and our challenges
LastPass has multiple components and services and these are being served from various infrastructures.
We are present on multiple cloud providers and on-premise datacenters across continents and regions.
Currently, we are also managing our workloads in a hybrid fashion as we are using Kubernetes clusters, cloud managed services and multiple fleets of virtual machines, manages by Puppet.
We are leveraging the Prometheus ecosystem heavily to observe our infrastructures.
At the moment we are operating 15 Prometheus instances, using ~10 exporters and multiple applications are instrumented with custom metrics. We are also using other data sources e.g. CloudWatch and Azure Monitor, and we have multiple Grafana instances to visualize all this data.
Our on-premise Prometheis are not containerized, these are also managed by Puppet.
These instances are running on quite large machines in terms of CPU and memory resources, and we have 60 days of retention for the metrics stored.
Our Kubernetes clusters have higher churn rate and high cardinality metrics, due to nature of the workload we have there: microservices and service meshes.
We are federating Prometheus instances to control the upstream volume of metrics with high cardinality.
In these clusters, we have 30 days of retention.
What problems and limitations we had with this setup?
For once, we had multiple single-point-of-failures as none of the Prometheus instances were redundant.
We rarely had issues related to this as they had enough resources to keep them reliable. However, when we had these rare occurrences, replaying the write-ahead-log took long upon restarts.
Additionally, if something would have happened to storage, e.g. data corruption or deletion, we would have lost valuable historical data from these systems.
Continuing this thought, we wanted to achieve more capacity storage-wise in these system to do trend analysis and capacity planning from these sources directly.
Also, sometimes we had to put in significant efforts to correlate issues across different infrastructures.
With data sources tied to specific Grafana instances, this process were unneccesrily complex and due to the different retention windows, it was not even possible in every cases.
What we wanted was basically a single metrics store, having all the metrics with all the infrastructures abstracted away.
We decided to solve all this by introducing Thanos.
Planning and preparation
First, we collected our pain points, and set the goals and scope for the project based on them. These are the problems that I mentioned in the previous section.
Then, we needed to choose a project.
Isn’t Prometheus enough?
As multiple solutions are out there, this phase needed research to compare all the projects against each other and against our goals.
After we settled with a project, we were able to break the implementations down to tasks and schedule the work.
The first sanity check we did was to ask ourself the following question:
Do we really need to introduce a new tech into our stack?
As it’s not uncommon to bump into extremely large Prometheus instances and setups where multiple Prometheis are scraping each other and since both methods are capable of handling large volume of metrics, this question was needed to be answered.
Federation can be either hierarchical and/or cross-service.
Hierarchical federation means that there’s a parent Prometheus gathering certain (or all of the) metrics from one or more Prometheus instances.
Cross-service federation, on the other hand, means that there are metrics available on multiple Prometheus instances, and to correlate these, one needs the metrics of the other.
This will inevatably means larger storage usage on the receiving Prometheus instances, which might be suboptimal, especially if you are planning to store all your historical time series for years locally.
The operational burden of the federeation fleet will increase, as keeping all these instances up-to-date, in-sync and and perform changes will be complex to automate.
Federation has its space and can work well in certain use-cases, e.g. we are using federation in our Istio clusters to reduce metrics cardinality, but to us, it doesn’t feels like a production-ready solution to solve our centralization problem.
As the infrastructure teams at LastPass prefer to manage their platforms themselves to have more room for aligning with our long-term infrastructure goals and to handle edge-cases more efficiently, we decided not to choose a managed SaaS as our centralized platform.
Exluding using vanilla Prometheus and managed services left us with the open-source landscape, and its 4 most promising candidates: M3, Victoriametrics, Cortex, and Thanos.
M3 vs. Victoriametrics vs. Cortex vs. Thanos
As the first step, we took a look at some Github statistics to get an overview of the landscape.
| M3 | Cortex | Victoriametrics | Thanos | |
|---|---|---|---|---|
| Github stars | 3.7k | 4.2k | 4.8k | 9.4k |
| Community/Support | Community meetings, office hours | CNCF incubated | Slack, Google Groups | CNCF incubated |
| # of contributors | 85 | 205 | 81 | 385 |
| Open issues | 43 | 233 | 339 | 163 |
| Open PRs | 97 | 40 | 5 | 46 |
M3 is an open-source distributed database coming originally from Uber. It’s fully compatible with Prometheus, but as we prefered a larger active community behind the our solution, we decided not to proceed to the proof-of-concept phase with M3.
Victoriametrics seemed to good to be true, at least initially.
There are multiple articles out there praising its performance and the improvements compared to the official Prometheus concepts.
However, after taking a closer look, we have find warnings indicating otherwise.
There’s this famous article by Robust Perception (and here’s the response also).
Then there’s the correctnes tests of Promlabs linked before, and there’s the results of the Prometheus Conformance Program.
On Promlab’s tests, Victoriametrics passed only 312 / 525 cases (59.43%).
On the latter, it scored 76%.
While we can dive into the explanations and see the reasoning behind these violated edge cases, it is clear that there are projects passing 100% of the tests by being 100% compatible with upstream Prometheus.
Also, stating the following in your docs, while (even if it’s for reasons) it’s not true can raise eyebrows:
“MetricsQL is backwards-compatible with PromQL…”
(source: https://docs.victoriametrics.com/MetricsQL)
Next one, Cortex.
Cortex is quite complex at the moment.
It needs Cassandra or DynamoDB/Bigtable as an object store for chunks.
This bumps up the operational cost, and the regular costs as well, especially when using managed services.
When using the HA Tracker, it needs an additional KV store, e.g. Consul or Etcd.
While it’s compatible with Prometheus, has an active community and it’s backed by CNCF, it’s a better fit for larger centralized metrics stores of enterprises than for us.
Note that there are plans on the long run to simplify the architecture and to decrease the operational cost, so these can turn things around when we are there.
As we are looking for a solution now, this left us with Thanos.
Thanos also has multiple components, but it has fewer external dependendencies.
Plus, you can introduce it gradually into your stack.
You can start with just adding sidecars to your Prometheus instances and set up an object store to have backups.
Then you can add the Query component to be able to query this data, and to deduplicate it, when running a HA pair of Prometheus instances.
Then, if you have more Prometheus instances managed by other teams, you can add Receive to leverage remote write and integrate these without the need of any addtional component from their end.
Thanos is fully compatible with Prometheus, has an active and large community, and can be scaled out to our needs in the future.
After a troughough comparison, we decided to go with Thanos.
Planning
After we settled with Thanos, we put together the following plan:
Create a DEV Observer cluster where we don’t risk any production data that would match our PROD cluster
Integrate our DEV Kubernetes cluster as an Observee
Create a proof-of-concept for Receive, to validate it before using for our on-premise integrations in production
Add meta-monitoring and alerting, so we can tune for performance and receive alerts when something breaks
Post-configuration and sizing of the components
Repeat all this, and go LIVE
After that, we could start the actual implementation.
Implementation
…and the problems we faced
First question: should we use Istio?
We are using Istio since the 1.5.x versions under production workload.
We are leveraging mTLS and ingress-gateways for our microservice traffic and using its telemetry to get useful metrics out-of-box.
We also made custom EnvoyFilters and we are using tracing.
All of these are valuable to us, and we are enjoying all the benefits Istio is providing us.
But, how much of these would be useful for Thanos?
Actually, not many of them.
On one hand, we could use Istio’s ingress-gateway to expose services and have mTLS on the endpoints. Without this, we would have to introduce another application to handle this.
But on the other hand we would need to take the following points into consideration.
Istio would add Envoy proxies to the workloads running in the mesh, and these would introduce an additional layer on top of the pods
Istio would come with a set of high cardinality meta-metrics for all the services in the mesh
Istio would be an additional dependency on our monitoring platform with its own lifycycle and everything that comes with this (patch management, fixing CVEs, etc.)
While these can be worked around and/or we could build toolin around these, we thought that the cons are clearly outweighing the pros.
Based on these, we decided not to include Istio on the monitoring platform.
Thanos 101
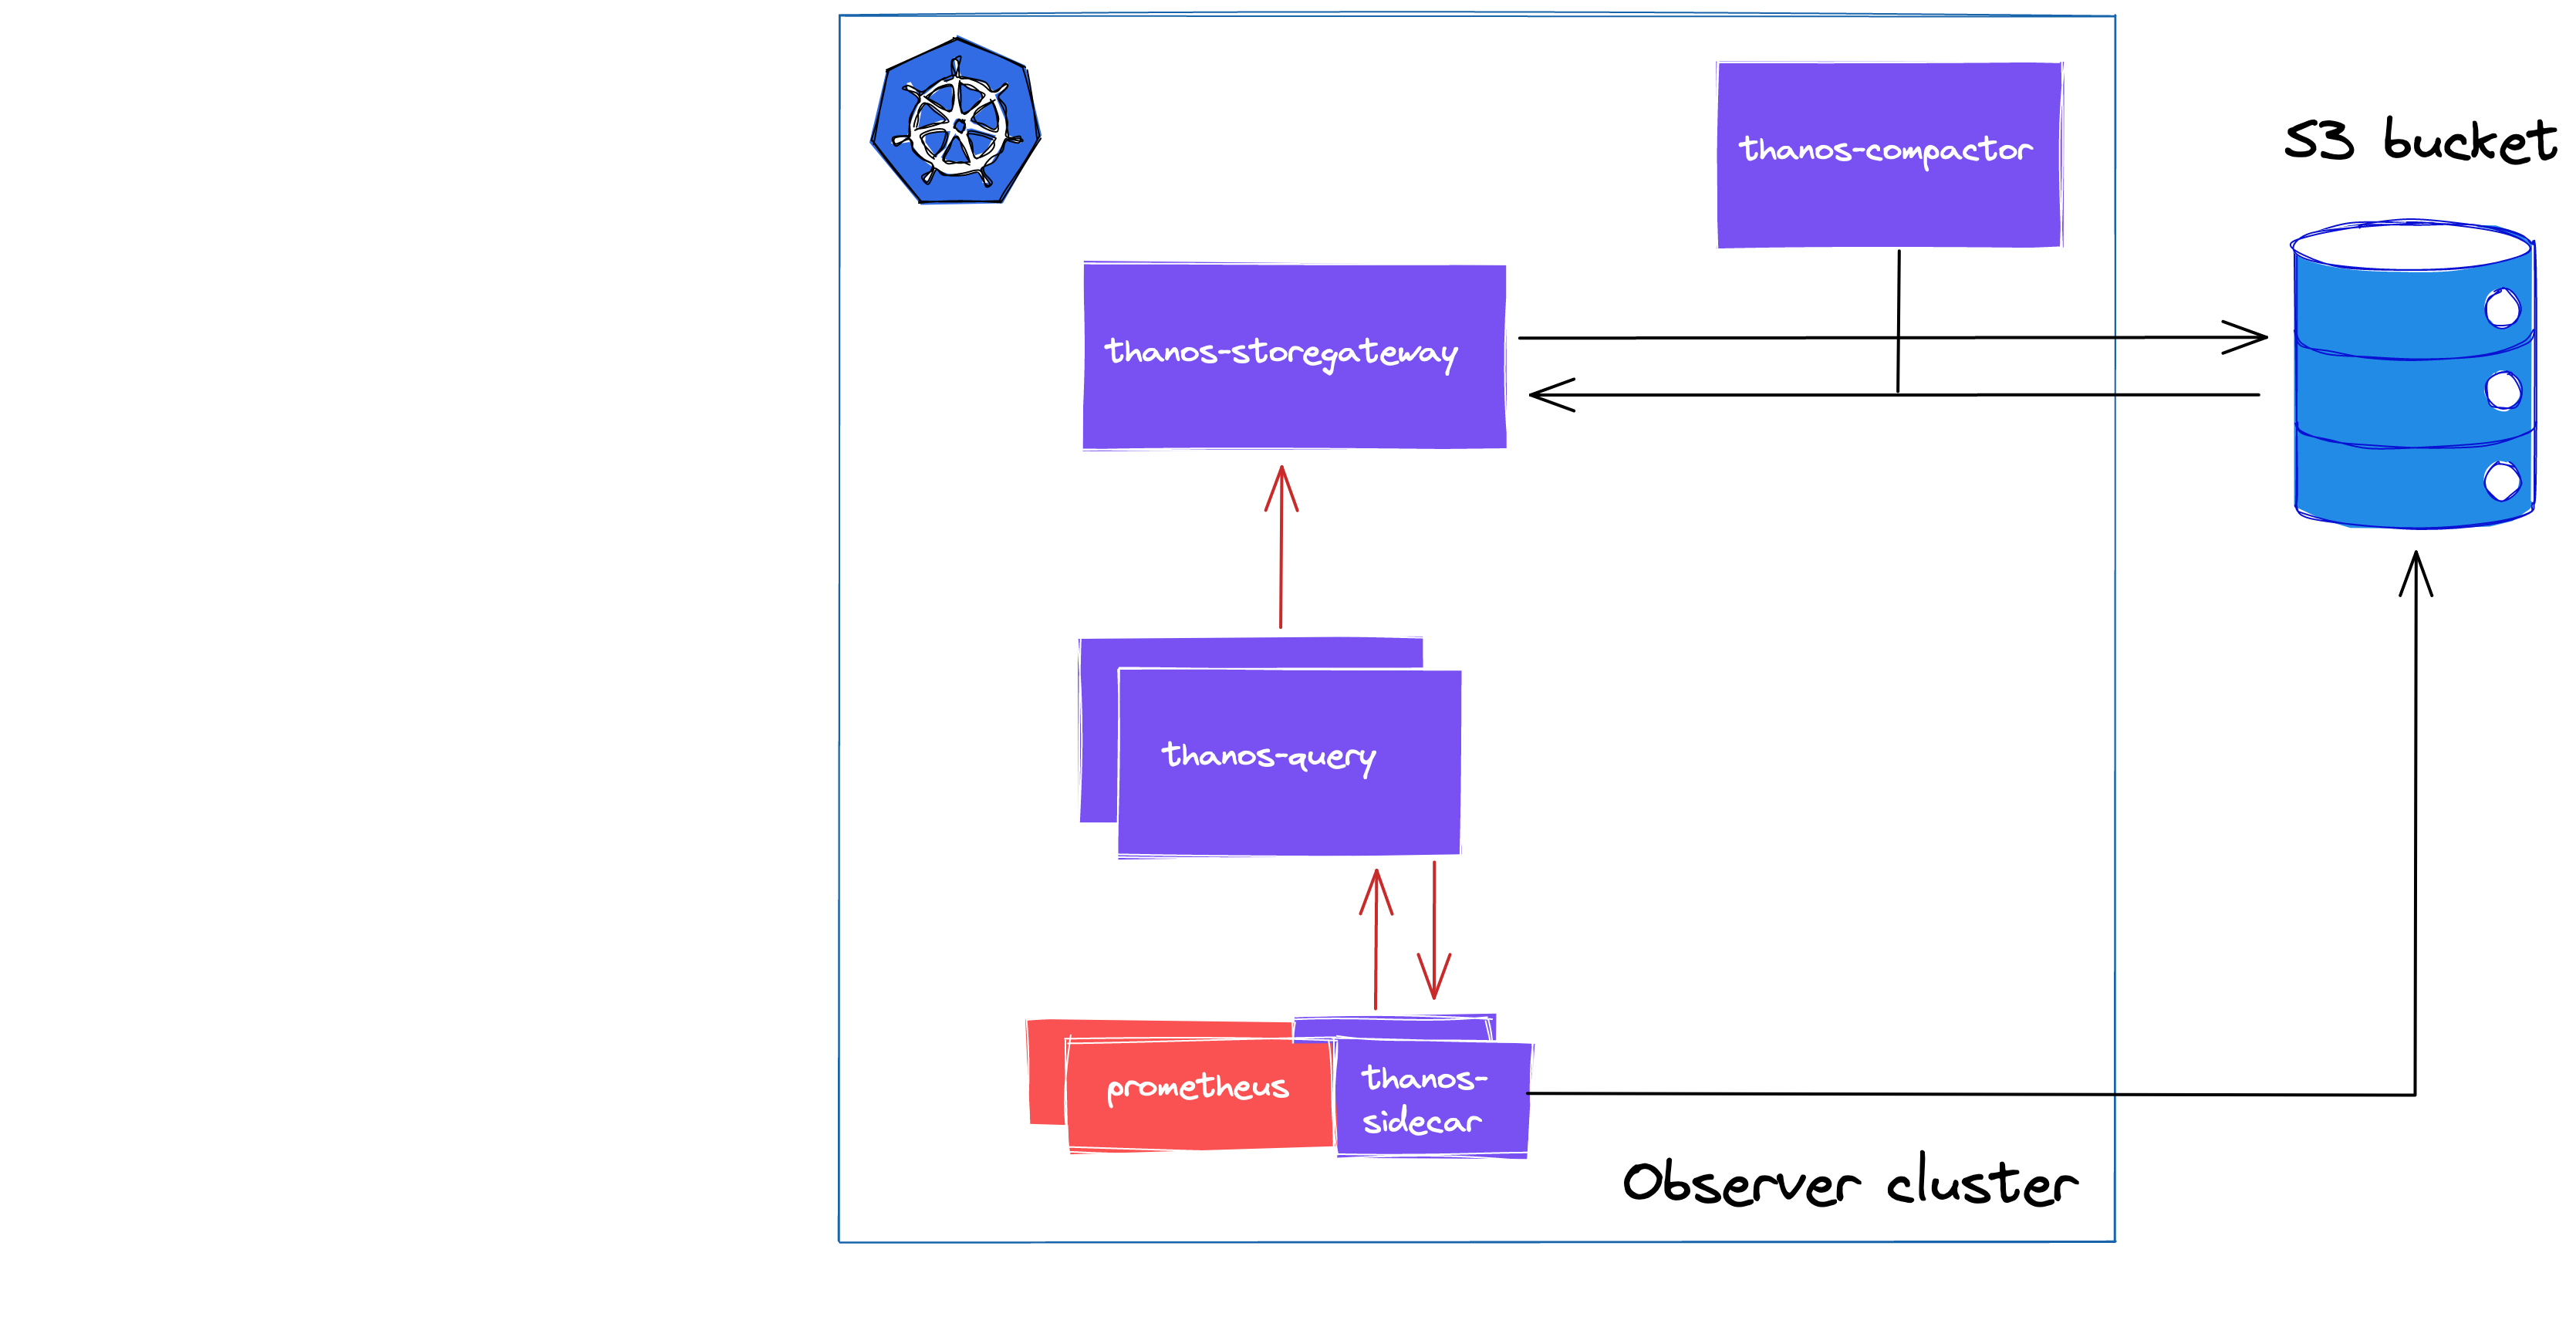
Thanos works like this in a nutshell:
You have one or more Prometheus instances.
You deploy a thanos-sidecar next to these instances.
These implement Thanos’ StoreAPI on Prometheus’ remote read API, and this makes it queriable for Thanos’s Query components.
Optionally, the sidecars can upload metrics to an object storage.
You have a Thanos Query instance, which evaluates queries on StoreAPIs, e.g. thanos-sidecars or object stores via the StorageGateway component.
Query makes run-time deduplication of redundant time series possible via external labels.
Adding a Compactor makes sense when you want to downsample your long term metrics, e.g. downsampling to 1h of blocks larger than 60 days.
If all that you want is to have redundant Prometheus instances without the need to manually switch between these when any of them is unavailable, you can start exploring Thanos by adding only sidecars to your replicas and putting a Query in front of these and you would be set.
As our goals were more ambitious than this, we started with the following setup, which is leveraging all of the aforementioned components.
Automate, always
Based on our plan mentioned above, we wanted to distinguish our Observee and Observer clusters as different infrastructures might be needed for these.
We wanted to use a single object store (an S3 bucket, in our case) per environment tier.
That means that we would have a single S3 bucket for both the Observer on the Observee clusters on DEV, and a seperate one for the PROD environments.
To access these buckets, you would also need roles and policies that you can reference via serviceAccounts at component level.
As nobody likes to repeat boring tasks all over again, automating these is always a good idea.
So, we decided to implement these “roles” at CloudFormation template level, so the resources required would be deployed automatically when we were creating or updating the actual clusters.
Initial Thanos deployment
After the DEV Observer cluster was deployed and the required resources were in place, we proceeded with deploying the local monitoring stack.
We are using Helm charts to manage both our tooling and production applications, so it wasn’t a question in the case of Thanos.
We are using the prometheus-community/kube-prometheus-stack chart to manage our Prometheus ecosystem monitoring our business workload, we used the same charts (with minor differences) to monitor our tooling platform as well.
For Thanos, we choosed the bitnami/thanos chart, as it seemed to be the most actively developed and used one.
Initially, we bumped up the replica count of Prometheus to two, and deployed the components of Thanos mentioned a few sections earlier.
At this point, we had HA Prometheus (with deduplicated time series), sidecars were shipping these to our DEV S3 bucket, and had Compact to compact and downsample these regularly.
Note: Bucketweb and Rule were also deployed to have tooling to validate blocks in the object store and to have alerting for our AlertManagers, but these are not providing core functonality and did not require advanced configurations.
Having just these components deployed on a non-production cluster enabled us to get familiar with the core functionalities while keeping complexity low. This was our initial playground.
Working ourselves towards our end goal, we needed to integrate the Observer cluster with our DEV Observee cluster.
Cross-cluster integration with Thanos
Currently, you can solve cross-cluster integration in various ways with Thanos.
Thanos Query in Observer cluster + Thanos sidecars running next to the Prometheus replicas in the Observee clusters
Thanos Query in Observer cluster + Thanos Queries in Observee clusters (this is called stacking)
Thanos Query + Thanos Receive in Observer cluster + enabled remote_write config in Prometheus configs of the Observee clusters
These are described in more details in one of my previous posts on Thanos, so I will only introduce the key points of the solution we settled with: stacking Query intances. If you are interested in the pros and cons of the other solutions, I’d suggest checking out that post.
Pictures work better than words sometimes, so here’s one:
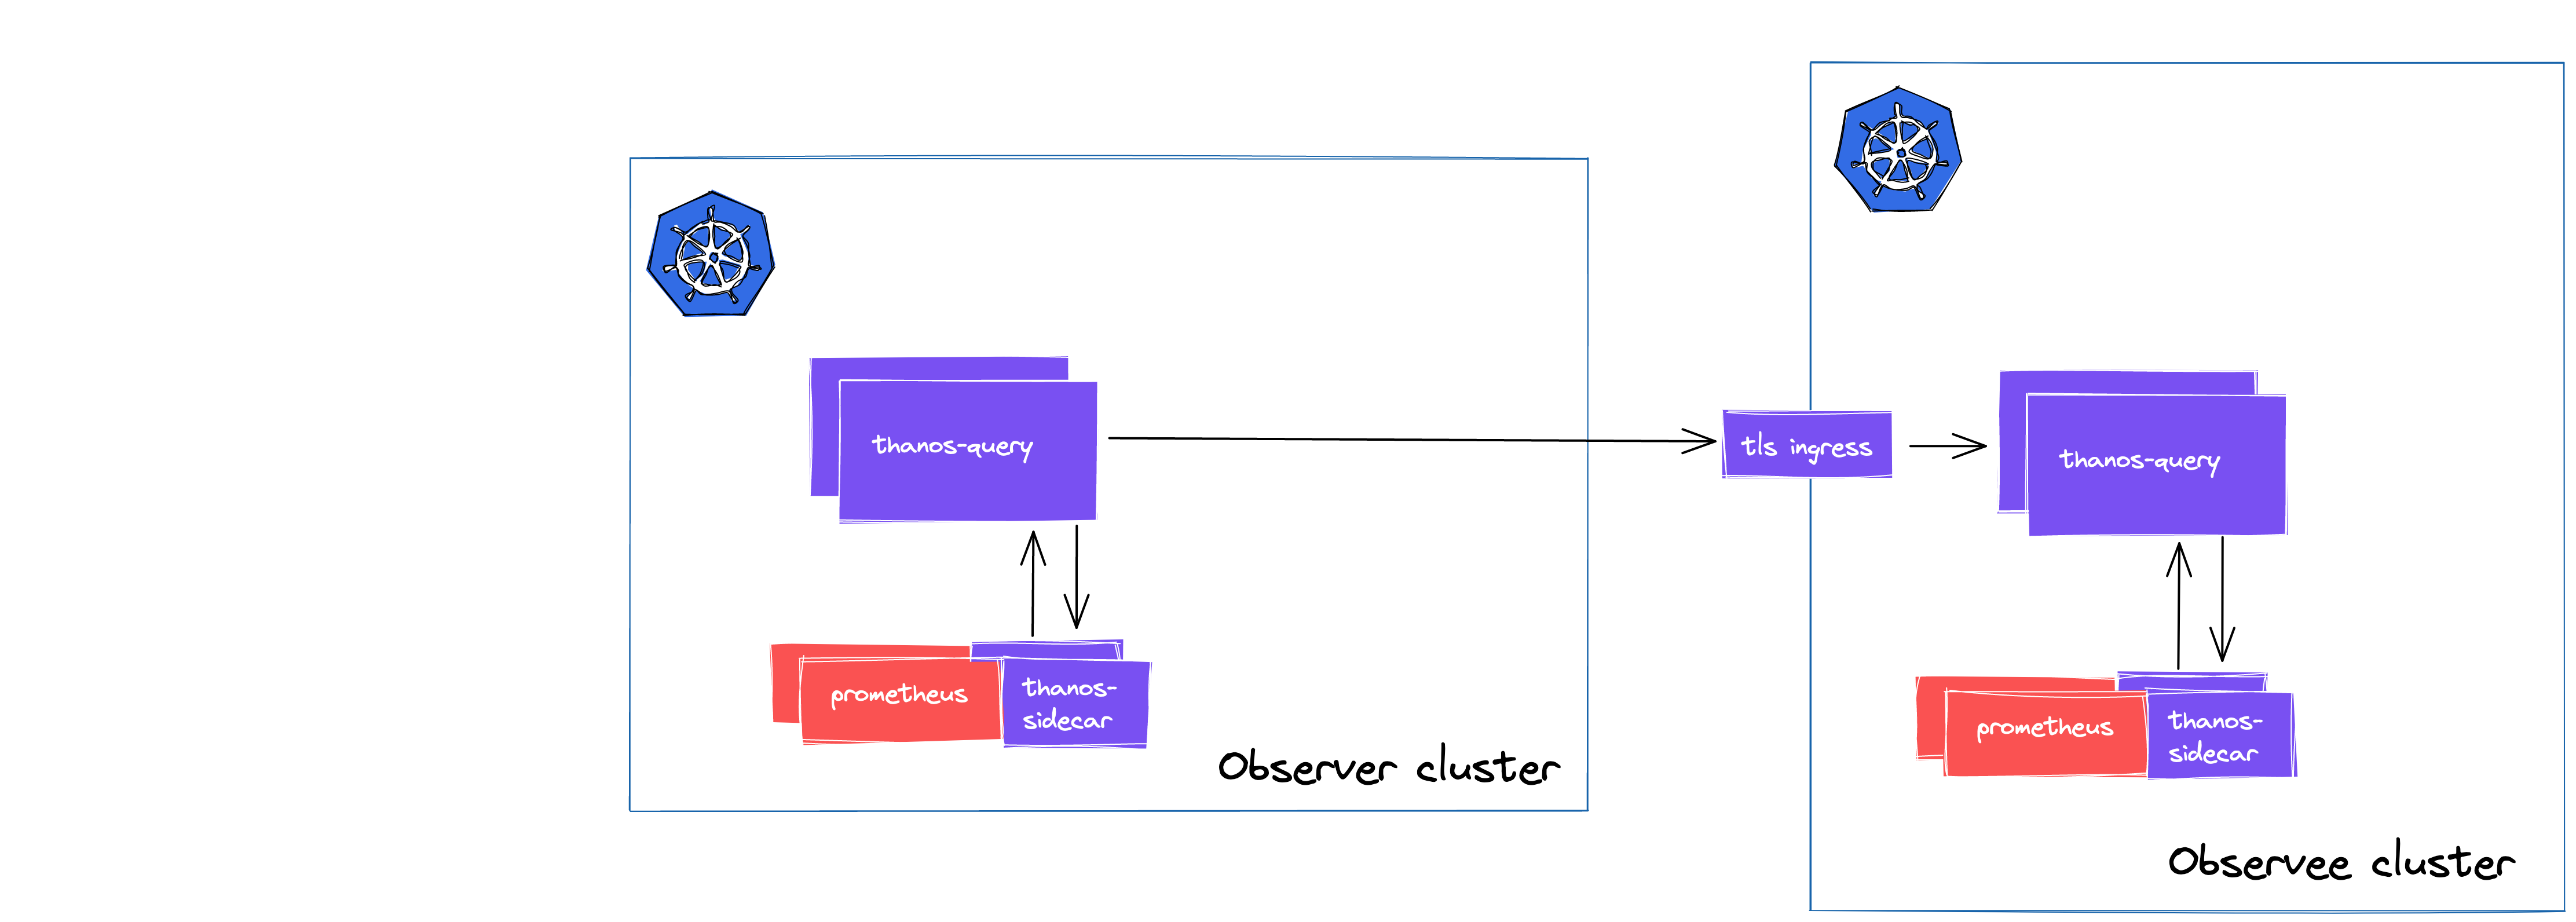
Basically, you have a simplified Thanos deployment in your Observee cluster which only contains Thanos Query.
This remote Query instance will locally discover all your Prometheis replicas, then you only need to expose this Query to integrate it with the Observer cluster. Following this method, you will be able to access all of the StoreAPIs at the remote clusters trough a single endpoint.
It’s a quite elegant way of solving the problem of integrating multiple HA pairs of Prometheus, but there’s an additional limitation to look out for.
We wanted to use different certificated cross-cluster and in-cluster, and unfortunately, this is not possible at the moment.
However, we can work this around with more stacking!
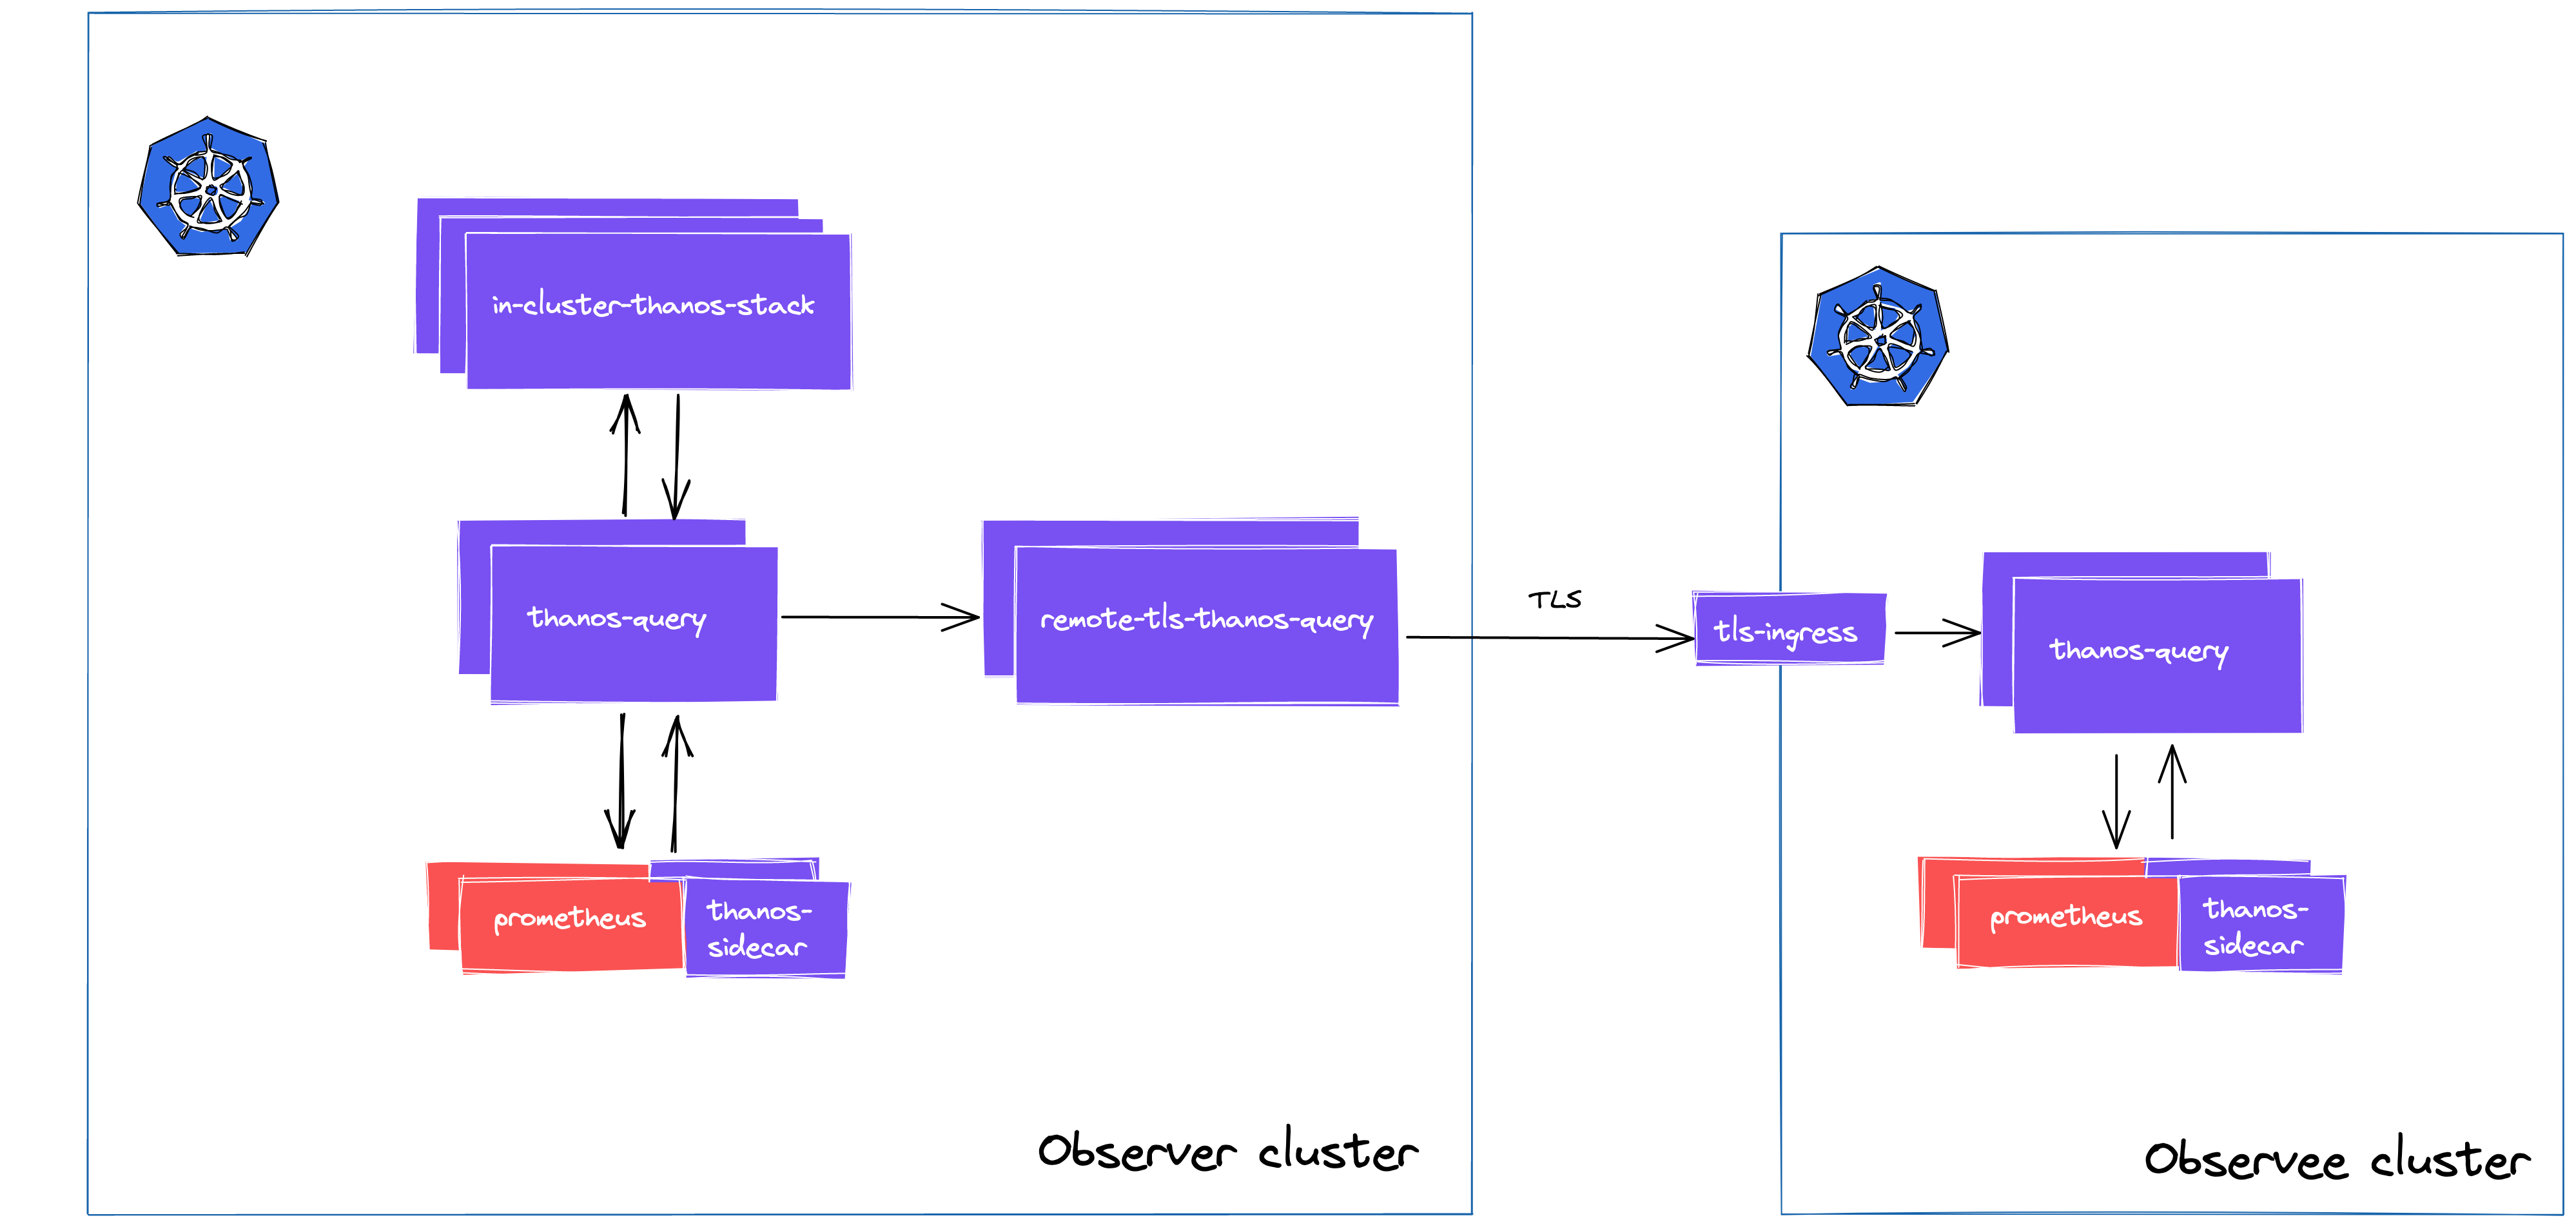
The workaround introduces more Query deployments in the Observer cluster, one for each of the remote clusters. As Query components have per-store limitation, you can stack together dedicated “remote-Queries” to enable managing multi-certificates.
Practically, you have a central Query deployment, which will be integrated with all the in-cluster compoenents, plus the additional remote-Quieries.
As I mentioned, we are using Helm charts, so our deployments are similar to these:
# thanos-query
query:
  dnsDiscovery:
    enabled: true
    sidecarsService: kube-prometheus-stack-thanos-discovery
    sidecarsNamespace: monitoring
  stores:
    - remote-tls-thanos-query.monitoring.svc.cluster.local:10901
# remote-tls-thanos-query
query:
  stores:
    - remote.thanos.cluster.com:443
  grpcTLS:
    client:
    secure: true
    servername: remote.thanos.cluster.com
    autoGenerated: false
If you are interested in the details, this post goes into more details.
This way, using multiple certificates for multiple purposes is easy.
Integrating on-premise datacenters
Our on-premise datacenters are running uncontainerized Prometheus instances. These are managed by Puppet, and because we are before a cloud migration, we did not want to migrate these to a Puppet-managed Thanos solutions. This would be tedious work, and since these were not HA pairs, we wanted to minimize the risk during the integrations.
Fortunately, Thanos has a component called Receive.
The architecture looks like this:
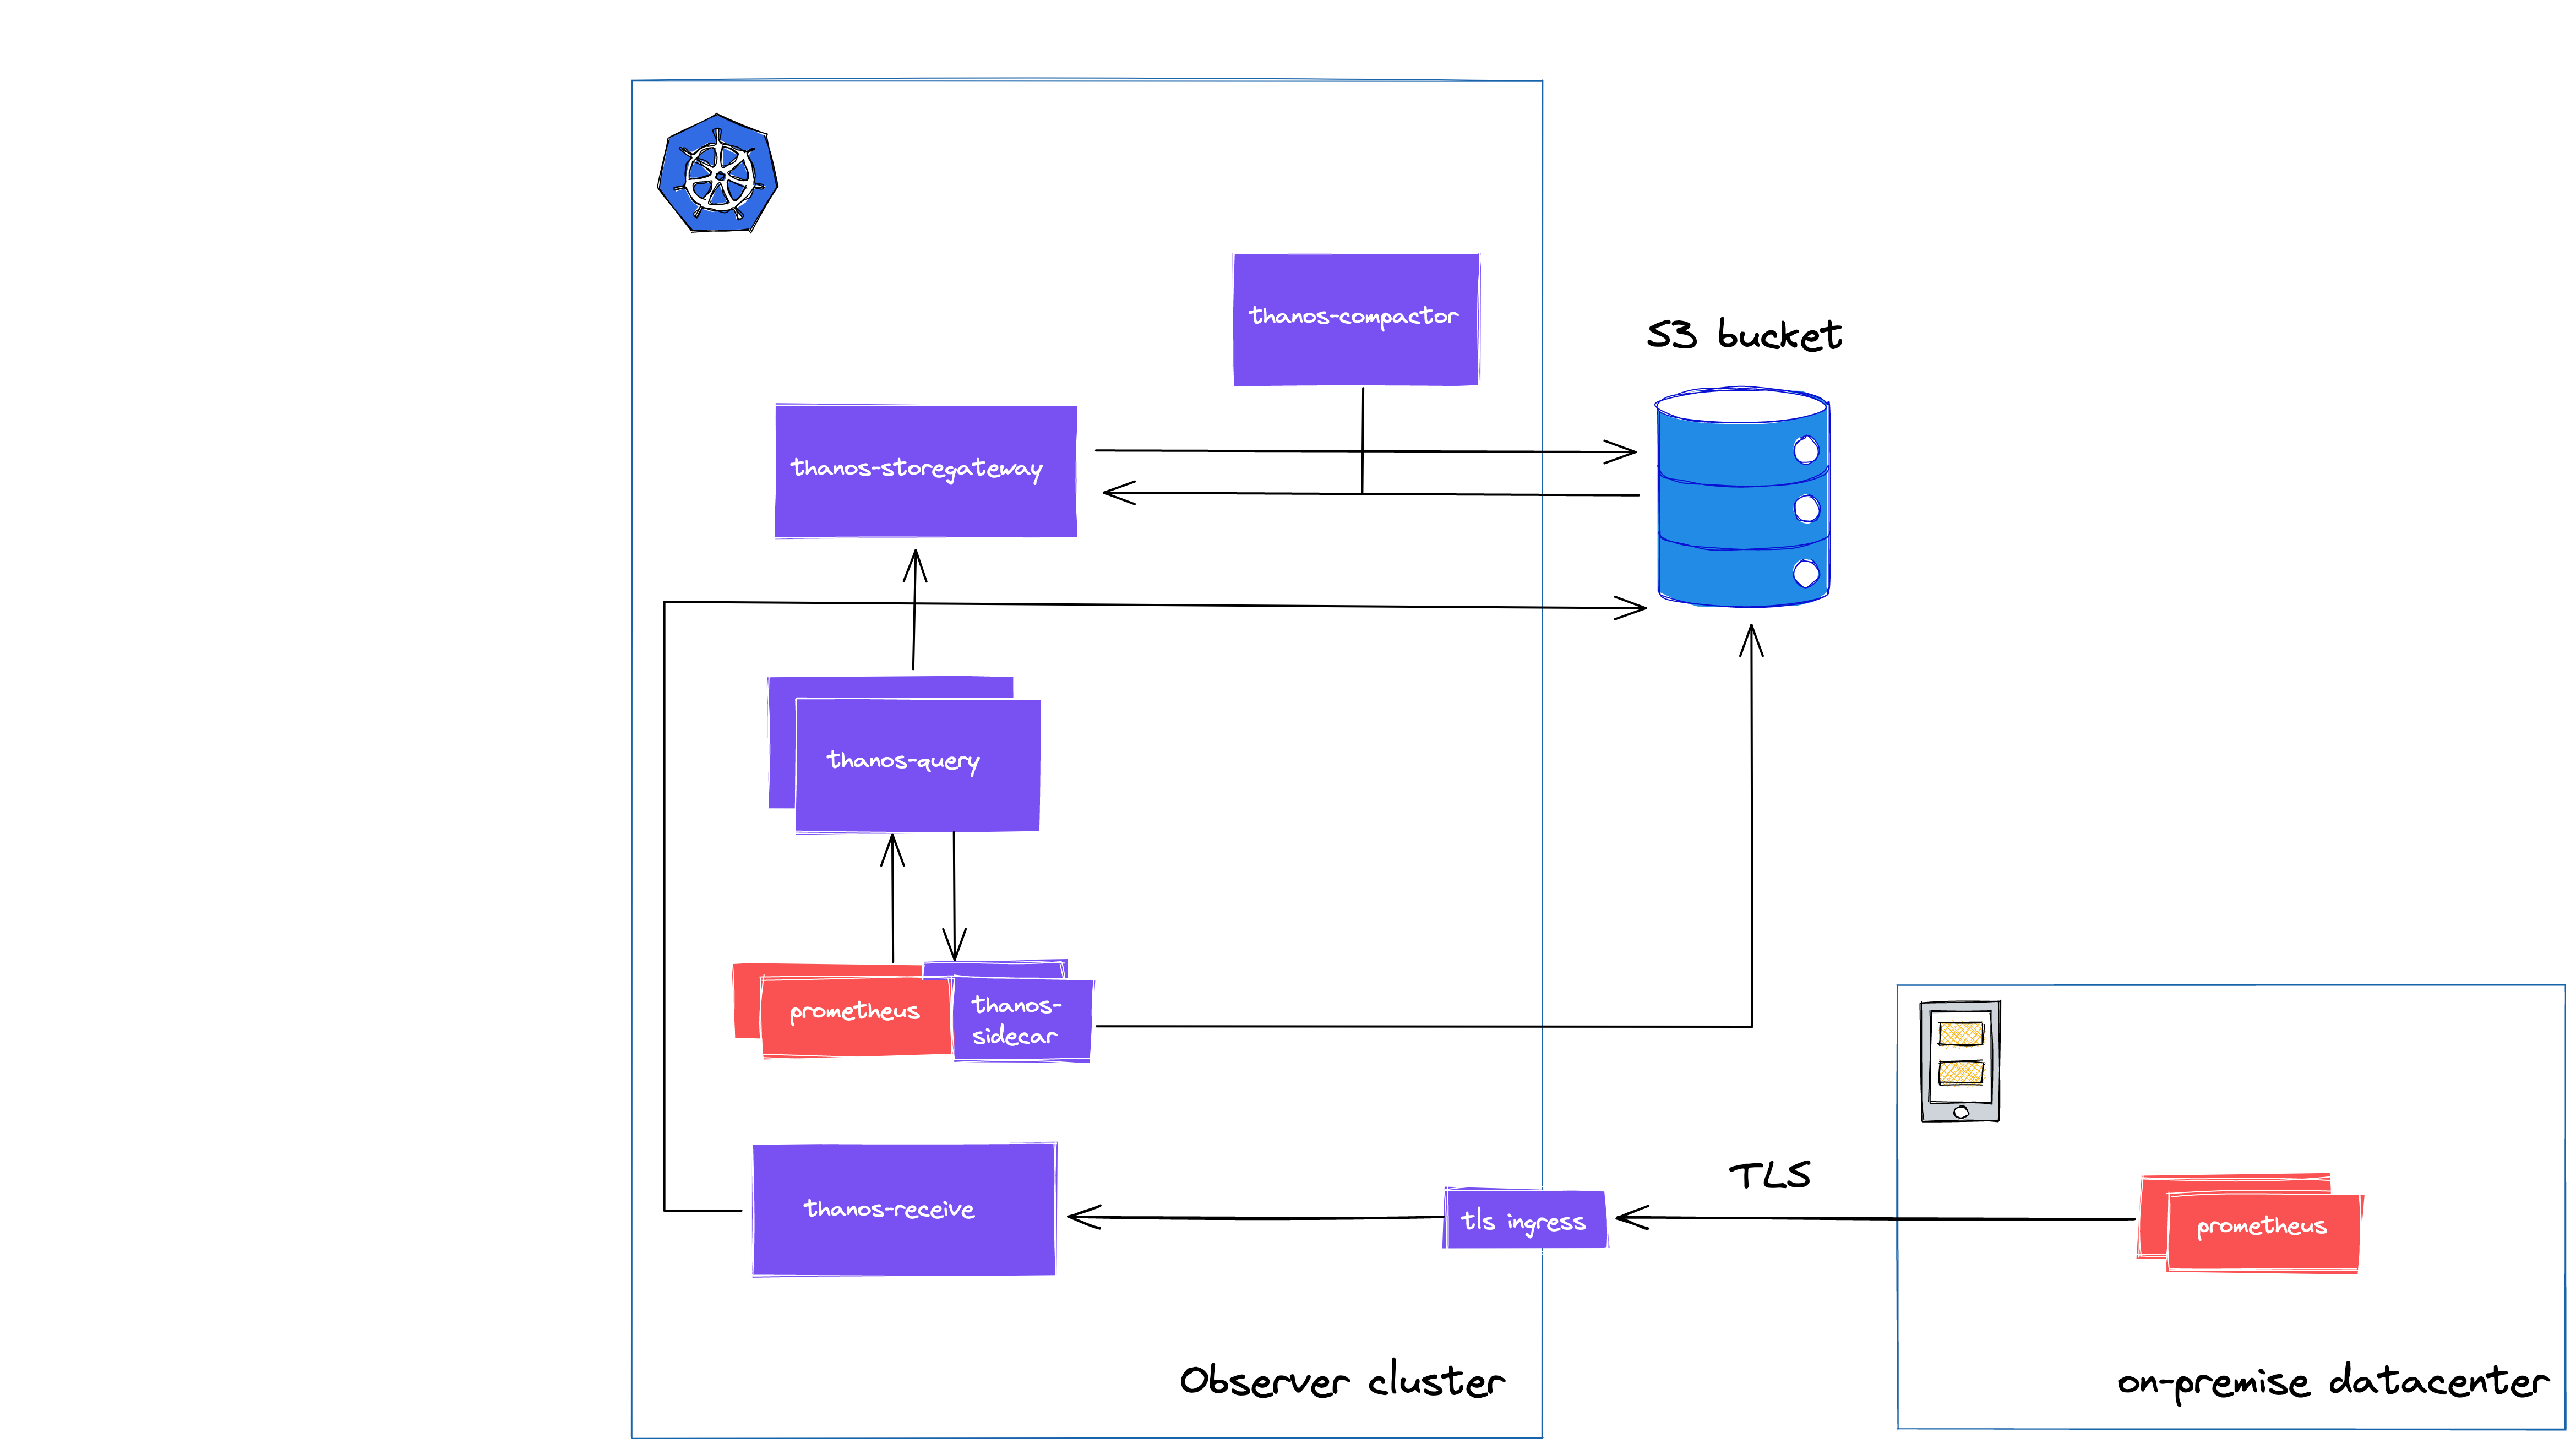
Receive is leveraging Prometheus’ remote write API, and apart from a small increase in resource usage, using it can be considered low risk, and there’s no need to introduce another problematic Puppet module.
Thanos Receive is using the same TSDB as Prometheus under the hood so there’s also a write-ahead-log (WAL) in place. The metrics are shipped two hourly to the object store, and you can also configure replication factor across instances. As these are improving our on-premise reliability, Receive seemed like a great fit for u to achieve global query view across on-premise.
Performance tuning & sizing Receive
Client side
Enabling remote write is easy, tuning it properly can take some time though.
There aren’t really silver bullet configurations, although the default values are claimed to be sane for most cases.
Below, I am listing the main config options, highlighting the effects of increasing/decreasing them.
capacity: the buffer per shard before blockig reading from WAL. You want to avoid frequent blocking but be aware that a value too high will increase memory usage as it will increase shard troughput. If you reduce max_shards, troughput will remain the same and network overhead will decrease.
max_shards and min_shards: max_shards is frequently configured to a lower value than the default (200, at the moment), mostly to reduce memory footprint or to avoid DDoSing a slower receiver endpoint. On the other hand, if prometheus_remote_storage_shards_desired is showing a higher number than you max_shards, you might need to increase its value. Increasing min_shards could speed up recovery upon Prometheus restarts, but overall its default value is proved to be a sane default to us as well.
max_samples_per_send: the batch size of sending requests. It’s recommended to increase the default value if the network is appears to be congested as it can cause too frequent requests to your receiver endpoint.
Based on our experiences, the rest of the config options are usually don’t require tuning.
These are min_backoff, max_backoff, and batch_send_deadline.
Keep in mind that max_shards should be lowered when you are increasing max_samples_per_send to avoid running out of memory.
If you would like to dive deeper into these settings, I recommend checking out these resources: Remote write tuning and the remote write troubleshooting guide by Grafana Labs.
Leveraging remote write metrics, dashboards and alerts will also useful during tuning for better performance.
Based on the docs, enabling remote write will increase the memory usage by ~25%, and our measurements were also aligned with these. Our instances reported increases in the 15-25% range.
Receive side
On the receiver side, you should look into esimating your resource usage and the disk space needed.
In one of my previous posts, I explored the problem of sizing the storage under Receive/Prometheus. I’d suggest to check it out for more a more detailed overview, but if you are only interested in the results, you can keep reading this post.
As Thanos Receive is using the same TSDB under the hood as Prometheus, we can estimate its storage requirements with the following formula:
needed disk space = retention * ingested samples per second * bytes per sample
We can use the following PromQL query to get results of our target instace (plus some overhead due to its implementations details):
(time() - prometheus_tsdb_lowest_timestamp_seconds) // retention
* rate(prometheus_tsdb_head_samples_appended_total[1h]) // ingested samples per second
* rate(prometheus_tsdb_compaction_chunk_size_bytes_sum[1h]) / rate(prometheus_tsdb_compaction_chunk_samples_sum[1h]) // bytes per sample
* 1.2 // 10% + 10% because of retention + compaction
* 1.05 // 5% for WAL
I also recommend checking out the excellent blog posts by Robust Perception on estimating RAM and on sizing the storage under Prometheus, plus this post on estimating WAL.
My post is using these heavily as references.
After all these, we had a full-fledged solution for our DEV environments with cross-cluster integration and a PoC for Receive in place.
At this point, we moved to finalising the resource requests and limits for all the components and addedd meta-monitoring to our Thanos stack.
We were a bit late with the latter, because right after we deployed our Thanos-mixin, we noticed that our Compact instance was silently failing for days due to the wrongly sized storage beneath it.
We learned that it’s always beneficial to add monitoring and alerting as soon as your applications should be functioning. Based on our this example, this is true not just for business applications but for tooling as well.
Based on the docs for Compact, Compact is only needed from time to time (when compaction happens), and we can safely expand its persistent storage betweend restarts, so the issue was resolved without problems.
To esimate the disk needed you can also rely on the docs:
Generally, for medium sized bucket about 100GB should be enough to keep working as the compacted time ranges grow over time. In worst case scenario compactor has to have space adequate to 2 times 2 weeks (if your maximum compaction level is 2 weeks) worth of smaller blocks to perform compaction.
But it’s recommended to monitor the resource usage during compaction from time to time. Of course having alerts for persistent volumes filling up can help with avoiding stressful situations.
After all the post-configuration happened and the whole stack was stable enough, we could move to production.
The steps were similar than before, but this time we made sure to add Thanos-mixin right after the components were deployed.
Making all this available to everyone
There was one more thing after the production deploy of Thanos happened: we needed to make all this data available to everyone.
For this, we decided to expose a new Grafana (also running on the Observer cluster) side-by-side with our original Grafana instances. This enabled gradual migration of configurations, dashboards, and datasources.
With this, we were also able to compare the original metrics with what we saw on our centralized platform.
After a few days of in-team testing, we invited “beta users” from the developer teams. Their feedback helped us to indentify small details that broke during the migration, so we could fix these before the official announcment.
We also organized knowledge sharing sessions, however these were mostly covering the new features, as we tried to limit changes of the core functionality to minimum (logically and visually as well), after all, you want as little novelty during on-call shifts as possible.
Stats, results, future
Our final production stack is ingesting almost 100k samples per second, and we have more than 3M head series.

These numbers are expected to change in the near future mostly due to our cloud migration around the corner.
However, when we get there, we will revisit our current implementations of recording rules, scrape configs, and federations, because we can still optimize our service mesh metrics collection, and while Thanos is able to handle much larger workload than our current setup, it’s always great to improve in areas whereever we can.
Our final production architecture looks like this.
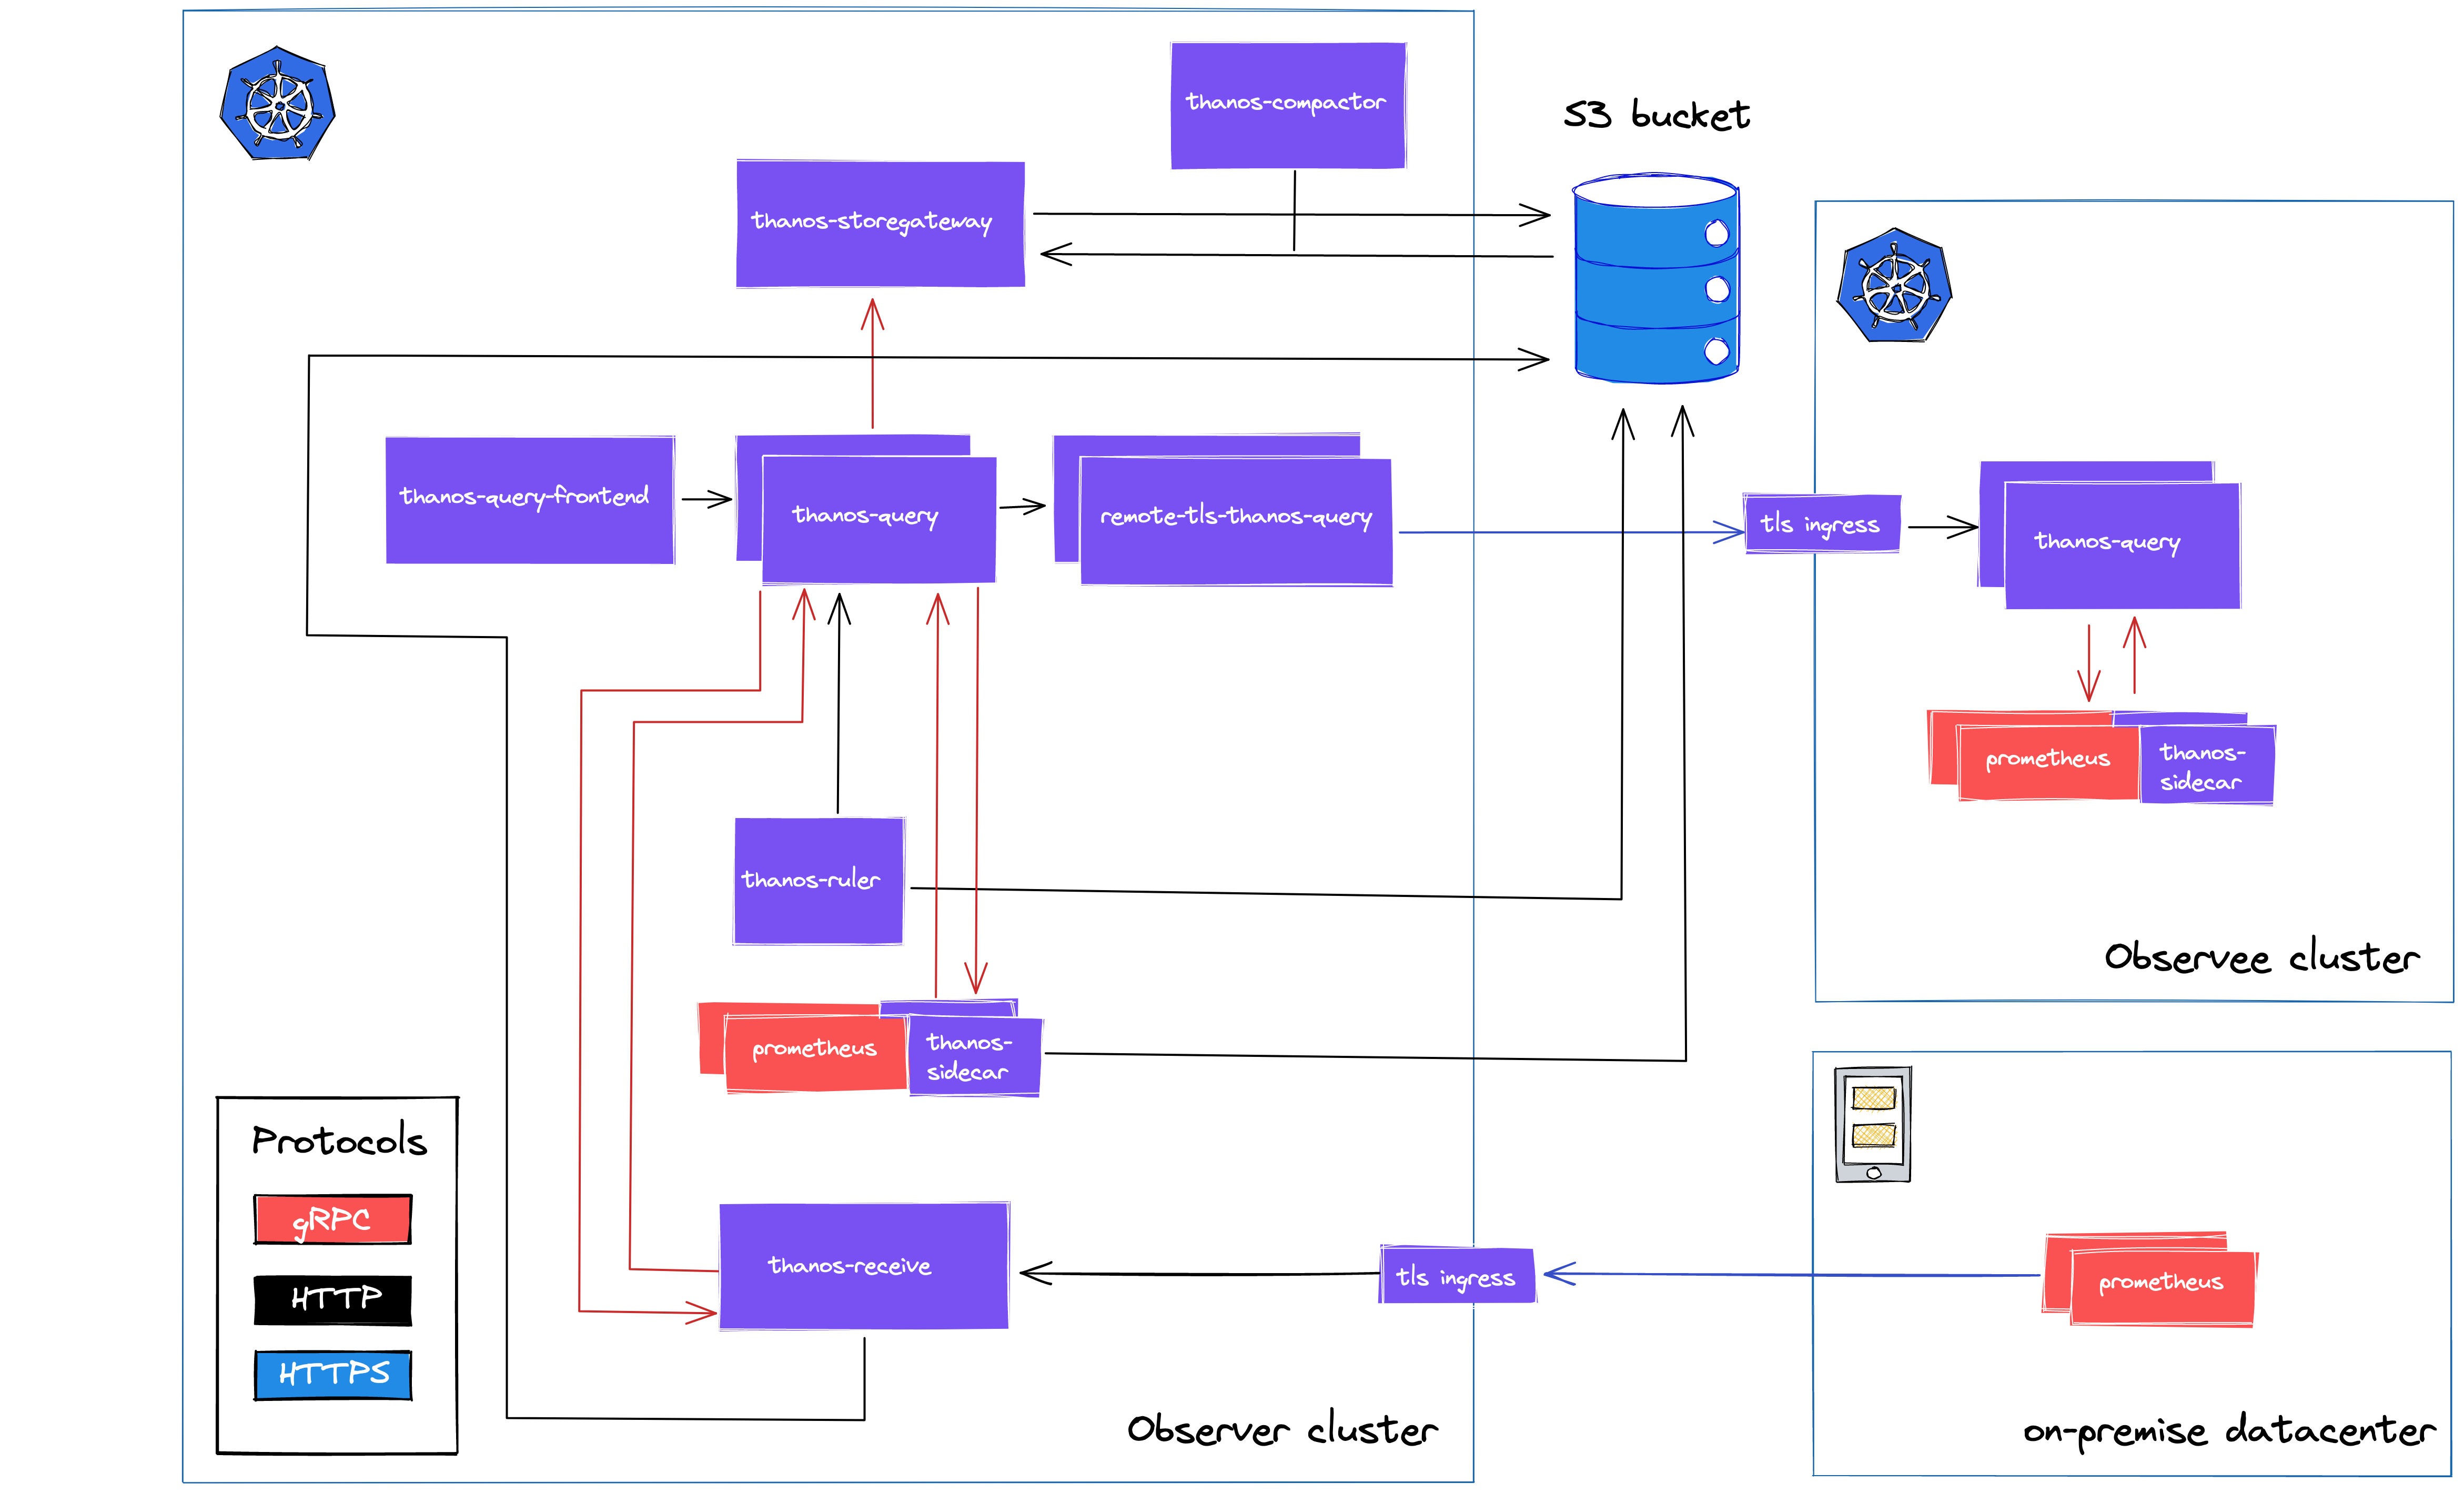
You can see how our central Observer cluster is integrated with its Observee cluster via a dedicated remote-tls Query instance, and how our on-premise tenants are forwarding time series data trough remote write to Thanos Receive’s TLS endpoint.
What’s next?
While no (software) project is ever finished, we feel that we built a solid platform that enables us to have a reliable global metrics store that can be further expanded/scaled, and most importantly make troubleshooting more effective.
Our shortest term goal is to extend our existing implementation of automatic Grafana Annotations to all of our releases. Having an automatic marker on any dashboard upon any of our applications’ releases is making correlating bugs with the matching code changes a breeze.
We are also planning to introduce a CloudWatch exporter to our stack to improve on our cloud correlation. This solution could also result more effective investigations by eliminating context switches when working with CloudWatch metrics.
On the longer run, we might explore our options of leveraging anomaly detection via our long retention metrics store.
But for now, we are enjoying the more effective on-call shifts and worrying less about the reliablity of any of our Prometheus setups.