Overview
Intro
The main reason I started this project was to have a place where I can publish technical articles. I couldn’t really choose between the well-known blogging services and I wanted to have full control of the platform that I am using.
Additionally, some of my topics will cover infrastructure-related areas, so having a self-hosted one for this goal seems to be a perfect fit.
The logical next step from here is to overengineer all of this, so I have decided to use K3s (a lightweight Kubernetes distribution) and introduced Istio (a service mesh) on top of that.
All this, to host a simple blog.
Architecture
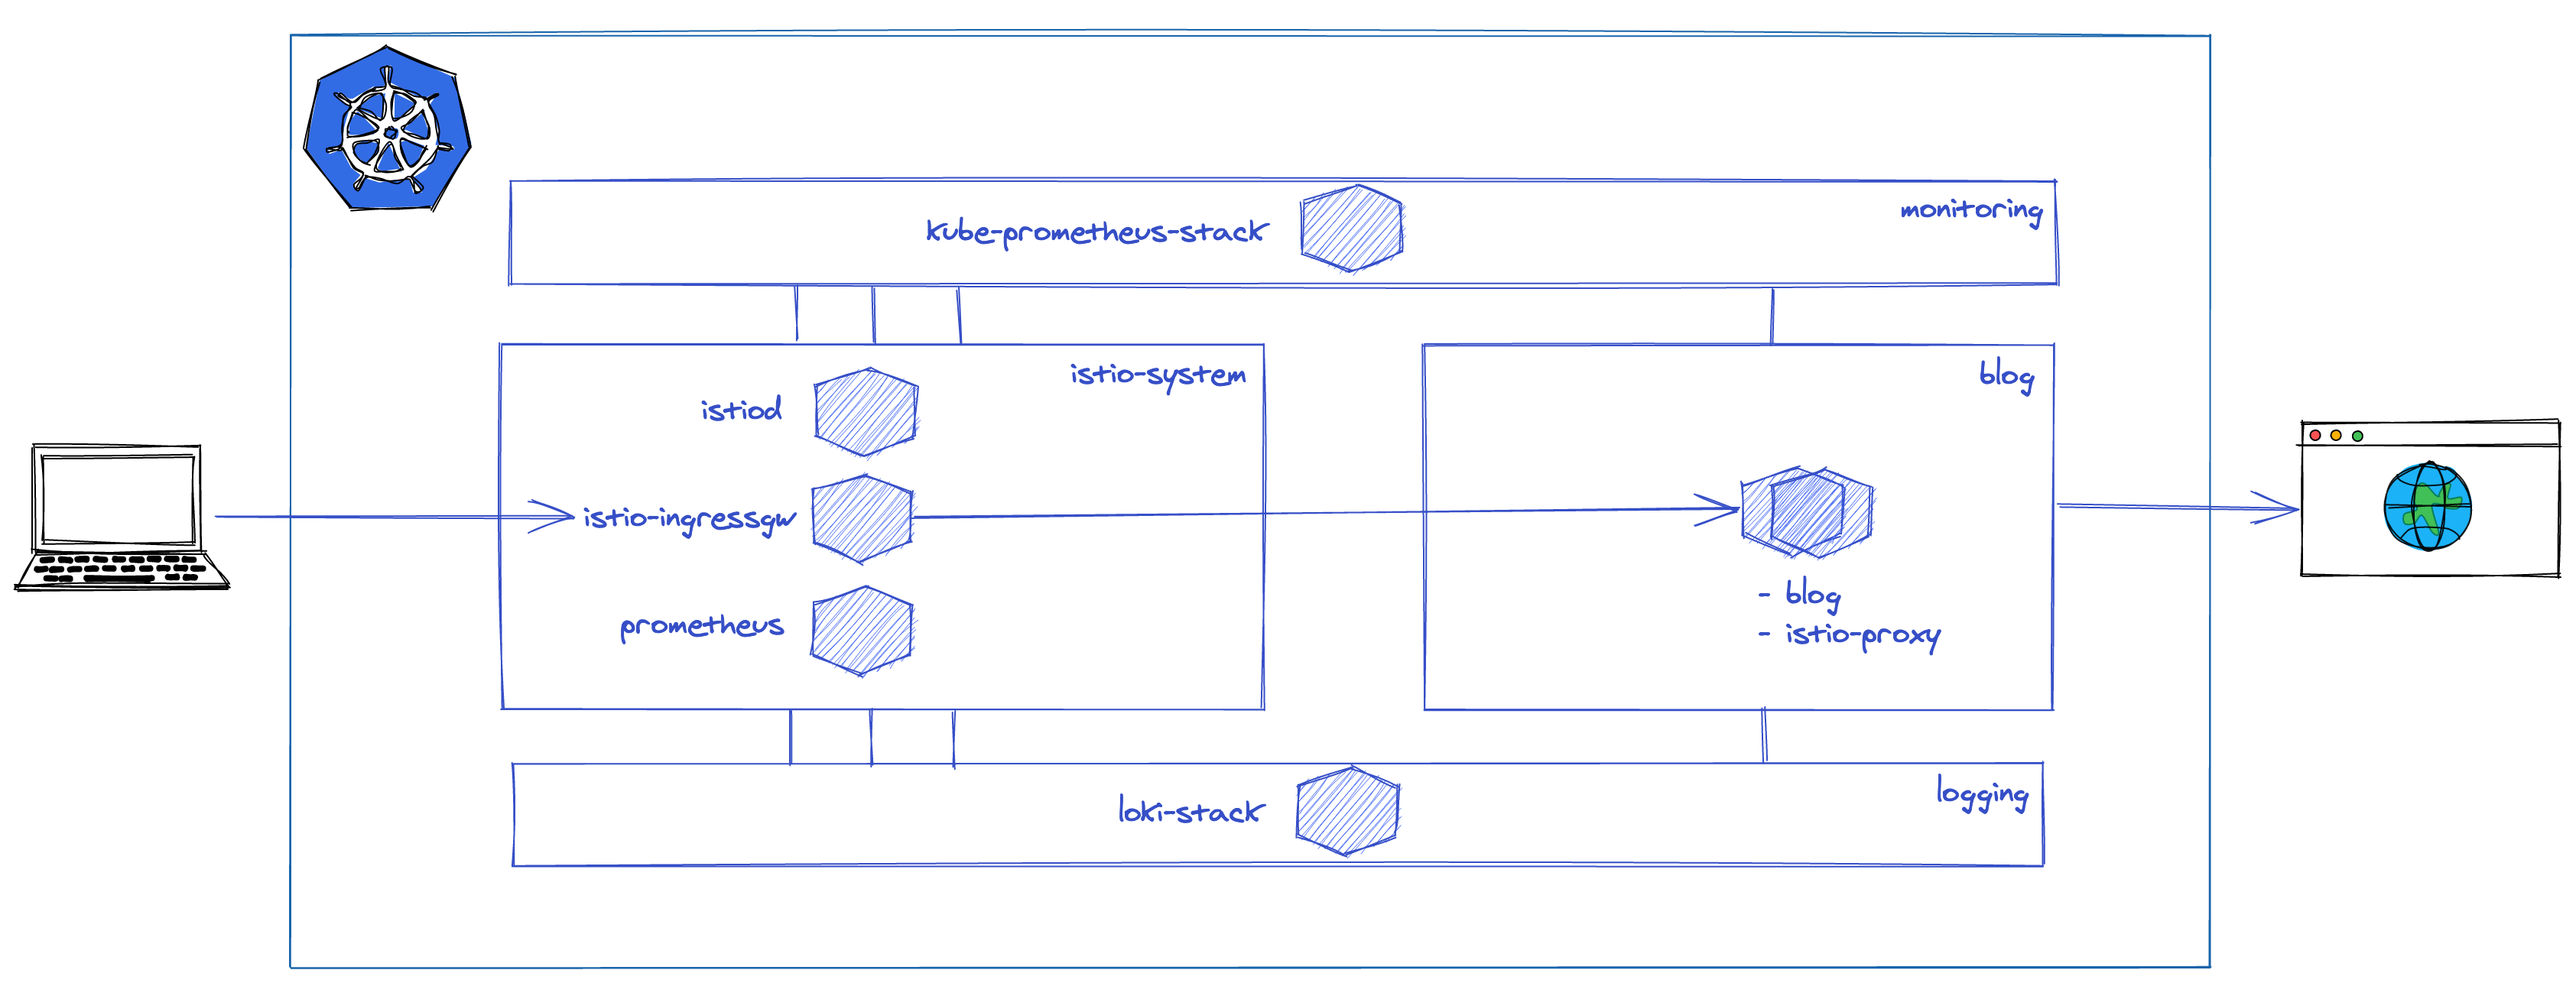
This diagram illustrates the architecture of the blog.

I am using istio-ingressgateway as ingress-controller for the cluster, so this is the point where anything can enter the service mesh.
The request will be then routed to the envoy sidecar of the blog Deployment through various Istio CRDs, then finally reach the Hugo application through NGINX.
I have the istio-system namespace for the usual Istio components, here I have Istiod as the control plane, ingress-gateways as loadbalancers, and a local Prometheus instance to get fine-grained control over the cardinality of my Istio related metrics via federation.
The application itself is running in a namespace called blog, which is istio-injected, so I have sidecars running next to all workloads in this namespace.
Additionally, I have two auxiliary namespaces, one for monitoring and one for logging. These are not istio-injected to keep their configuration simple.
In these, I am running a simplified set of kube-prometheus-stack components and an even simplier version of the loki-stack.
Declarative configurations for everything
I have two repositories, one for infrastructure and one for the application itself.
The idea here is to have declarative and version controlled application definitions, configurations, and environments.
I am hosting on Digital Ocean, so after a droplet is spinned up and a K3s cluster is created, I can just simply cd into the infra repo, and execute
$ helmfile sync
which will install Istio, configure its components, and take care of setting up the TLS certificate as well.
This can be achieved with a helmfile like this one (it’s just an excerpt):
repositories:
  - name: incubator
    url: https://charts.helm.sh/incubator
  - name: istio
    url: git+https://github.com/istio/istio@manifests/charts?sparse=0&ref=1.9.3
  - name: istio-control
    url: git+https://github.com/istio/istio@manifests/charts/istio-control?sparse=0&ref=1.9.3
...

releases:
  - name: istio-base
    chart: istio/base
    namespace: istio-system
    createNamespace: true

  - name: istio-discovery
    chart: istio-control/istio-discovery
    namespace: istio-system
    needs:
      - istio-system/istio-base
    values:
      - global:
          hub: docker.io/istio
          tag: 1.9.3
      - pilot:
          resources:
            requests:
              cpu: 500m
              memory: 2048Mi
          autoscaleEnabled: false
      - meshConfig:
          accessLogFile: /dev/stdout
...
At this point, I have a few additional yaml files to manage security policies, telemetry, and a simple manifest that describes the deployment of the blog. These should be also implemented as part of the helmfile pipeline.
All this lays a solid foundation for implementing GitOps later with flux and/or Argo CD.
Application
The application is a simple Hugo blog, which resides in a repository called blog.
All the artifacts are here, next to a Dockerfile, which is used to build the container that’s being deployed by the aforementioned yaml file.
When I want to have a new version of the blog out, I just have to re-generate the site and push a new Docker image, then after the deployment is restarted the new version is out.
This part can be automated further like the infrastructure itself of course, but the current state is simple enough and provides convenient workflows.
Monitoring
One of the main reasons behind using Istio for this project was to have an extensive set of metrics related to the services I am running.
Istio gives you these nearly out of the box, but there’s a price to pay, because you will be dealing with tons of high cardinality metrics, and these require some additional care before you can really leverage the potential of having them. More on this later.
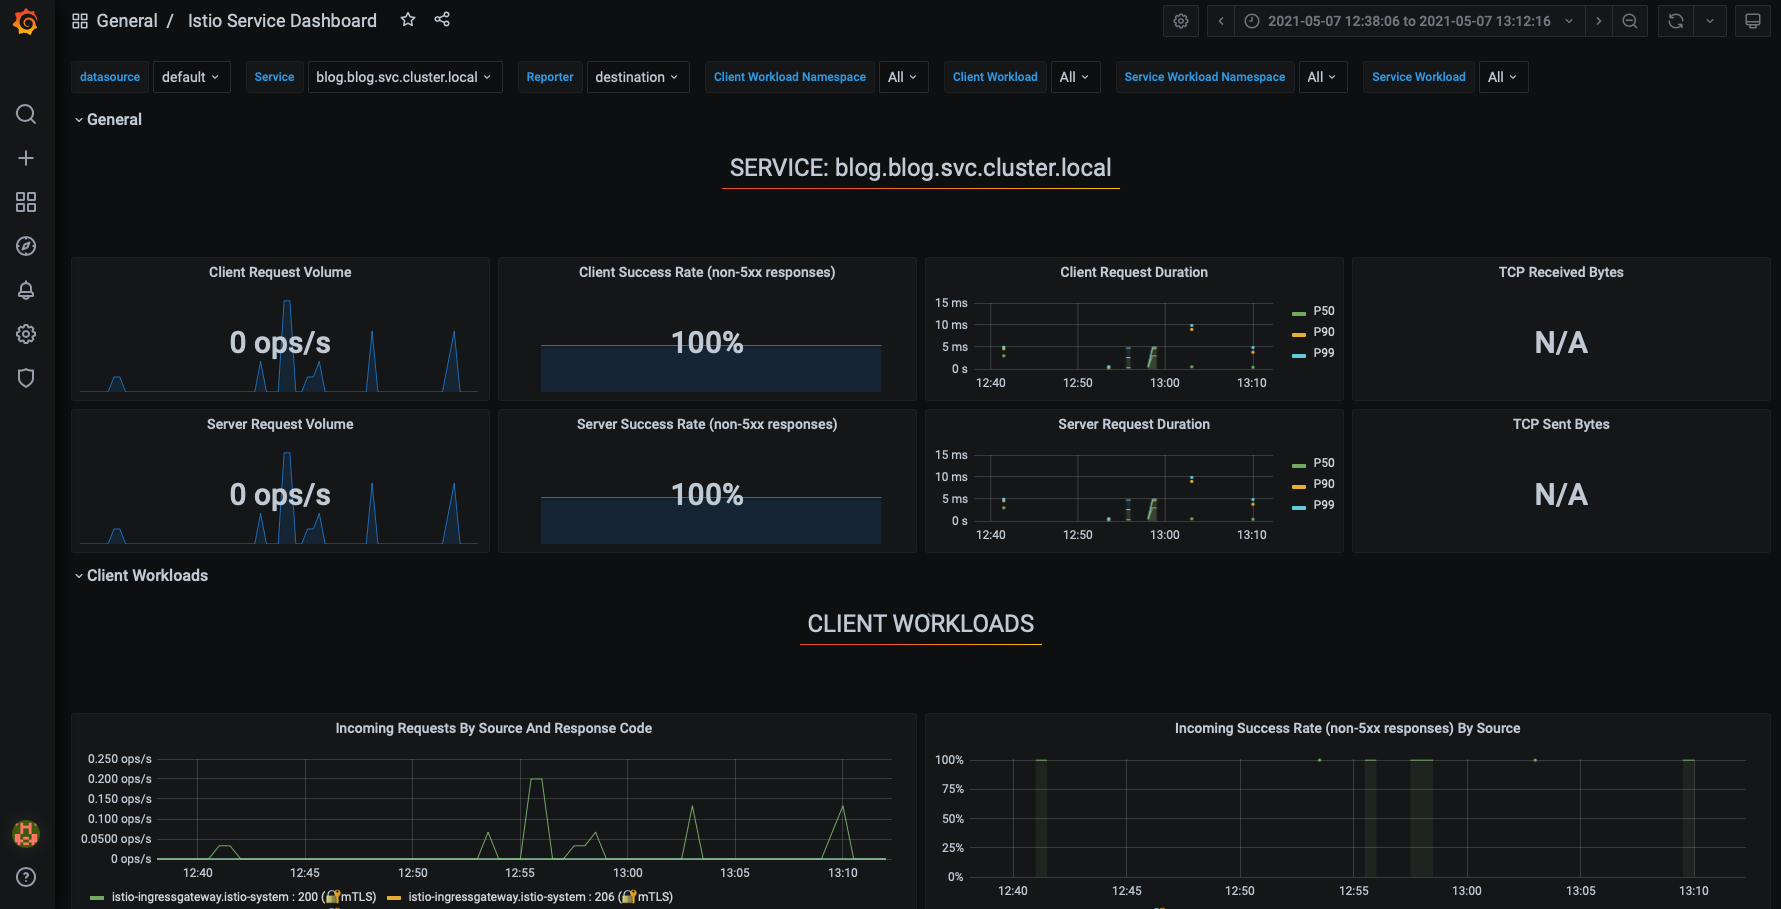
This is a snippet of what you can get.

All this (and much more!), without a single line of code at the application level.
I am using kube-prometheus-stack to deploy Prometheus-operator and its ecosystem, and I am using a custom version of the Prometheus installation referenced by Istio.
These are set up in a federated fashion to achieve the Istio Observability Best Practices.
I have a dedicated helm chart to manage my custom Grafana dashboards, which should also be added to the helmfile workflow.
Logging
I always wanted to try out Loki (by Grafana), but up to this point, I never had the time to add it to a project.
For this blog, I wanted to have a simple, lightweight log-aggregator that can grep all the logs of the pods, store these efficiently, and since Loki can do exactly that and since it can make the correlation with Prometheus metrics a breeze it was a good match.
Like the rest of the stack, Loki is deployed via Helm charts, I am using the official loki-stack for this purpose.
This chart extends the chart of each individual component’s charts, and these can be also found in this repository in case anyone would need to check all possible configuration options.
I am using Loki with Promtail as the log-forwarder agent, and without Grafana, because Loki is added to kube-prometheus-stack’s Grafana as a datasource.
One thing that I would definitely highlight here is setting appropriate resource requests and limits because without these the components might run amok. And there are only a few things worst than missing logs because of CPU throttling or OOMKills.
I have a fairly simple configuration with BoltDB Shipper set up for storing the index on the local filesystem.
To get an overview of the performance of this implementation, I have ServiceMonitors enabled for both components. This way I can visualize the performance on Grafana dashboards and detect any bottlenecks.
Be aware that Loki is not your regular log-aggregator, so pay close attention to the best practices especially to high cardinality, because their tagline is true in this regard as well:
Like Prometheus, but for logs.
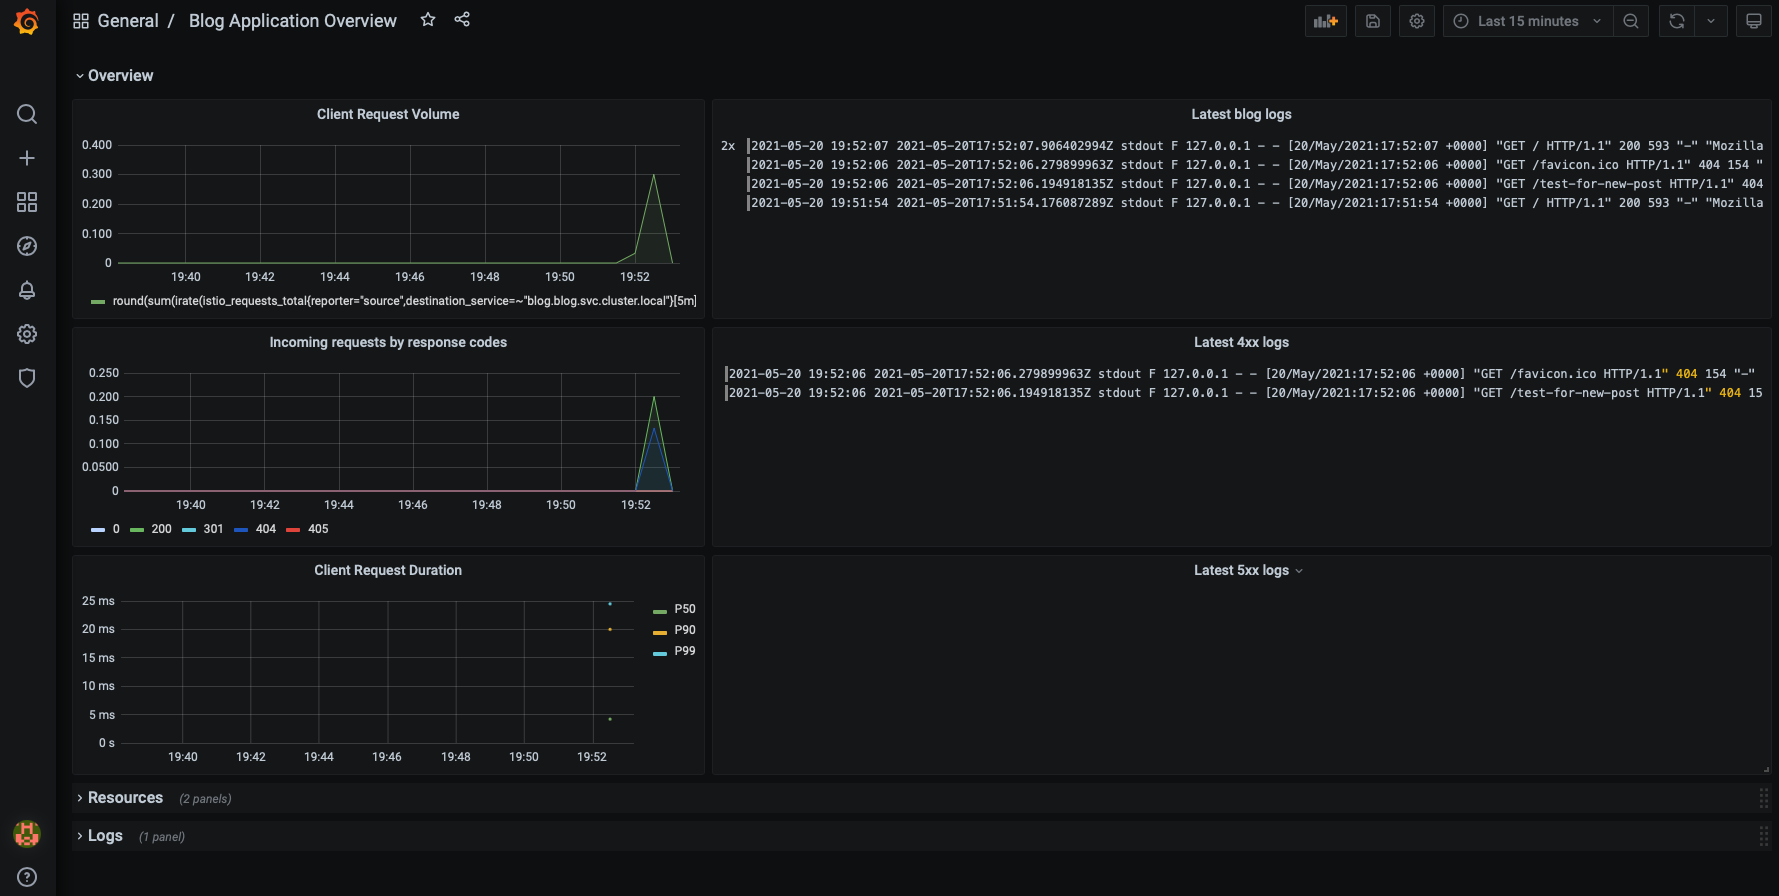
Now, it’s possible to visualize the logs right next to the metrics.

Outro
All of this took just a few hours to set up, which was surprising to me as well.
- Domain registration + basic DNS management: 0.5h
- Initial configuration of K3d + Istio + TLS: 1h
- Setting up the blog itself: 1h
- Implementing the helmfile pipeline, adding monitoring, and refining security policies: 1.5h
- Adding logging: 1h
Sum: 5h
Basically, I was able to push a working PoC out under 2h, which is great. Of course, this wouldn’t be possible without countless hours of Istio troubleshooting in production, which is what I am doing at my daily job for almost a year now.
Deciding on the tech behind the blog itself required some research as I was not familiar with the current options. My first plan was to use Ghost, but I’ve switched to Hugo to reduce complexity. So we can add a few hours of research to the final sum.
Overengineered? Yes, probably. But isn’t most of the architectures out there?
That’s not an excuse of course.
We will see.