RCA/2022-08-10 - P1 - Hetzner Cloud node outage
On August 10, I received the following e-mail from Hetzner:
Fault report cloud node xxxxx Due to a current error, the cloud node (xxxxx) and the cloud servers on it are not accessible. Type: Outage State: in progress Start: 2022-08-10, 07:49 AM UTC The following products are affected: blog #xxxxx blog
It happened during my waking hours, but I was in a call at work, and after I validated that my blog was indeed not available, I decided to wait this one out.
I will explore the incident by looking into the data I had, and see how I can improve my the current setup.
Note: I asked Hetzner for additional details. If I get these I will update the post with the new information.
As I was not participating in resolving the issue, this will be a somewhat irregular take on RCAs.
Note: Unfortunately, I am pretty sure that this is not that irregular. Tech companies can take the very same approach, and “miss” outages like this. Why? Most of the time they don’t have proper processes/priorities/resources in place for these incidents. E.g. missing alerts/ownership/runbooks, etc. and they can just write the postmortem in a similar fashion after the incident - if they even do that.
Assessing conditions
Let’s start with what we know.
My Hetzner Cloud node was unavailable, this affected my VM, thus my cluster, thus my blog. After checking krisztianfekete.org, this was true, indeed.
Let’s dive into my telemetry data, and see
- what the actual outage meant for my users,
- how the incident looked like from my site’s point of view?
Let’s take the first question first, and get the actual timeframe when my site was unavailable!
You could do this by checking your alerts.
Wait, there were no alerts. How could that happen?
Digression: Up until this point I deliberately payed little attention to have alerts covering everything, especially things that are out of my reach. This blog is not mission critical. Most people running blogs on hosted platforms either won’t get notified in similar situations, or they just don’t care. It will we up soon probably anyway. I have alerts covering my application, I am leveraging the various mixins for my tooling, and I also have some custom ones. Since I am running this blog, I’ve received maybe 5 alerts, all of those were just basically warnings, and only one or two of them turned into action items. It’s nice to have them, so I can create a backlog of things to improve, but I am trying to keep the signal/noise ratio low in this setup. This might worth another blog post as it’s working fine for more than a year now.
As I mentioned, the root cause it unknown at this point, it’s definitely possible that the node hosting my VM just disappeared, and even if some of my alerts would have make it close to getting into the firing state, they might not even had the chance to reach me from the cluster.
There’s a not that well known synthetic time series in Prometheus that let’s you check the historical data of your pending the firing alerts. It’s called ALERTS.
Let’s check which state my alerts were in during the incident!
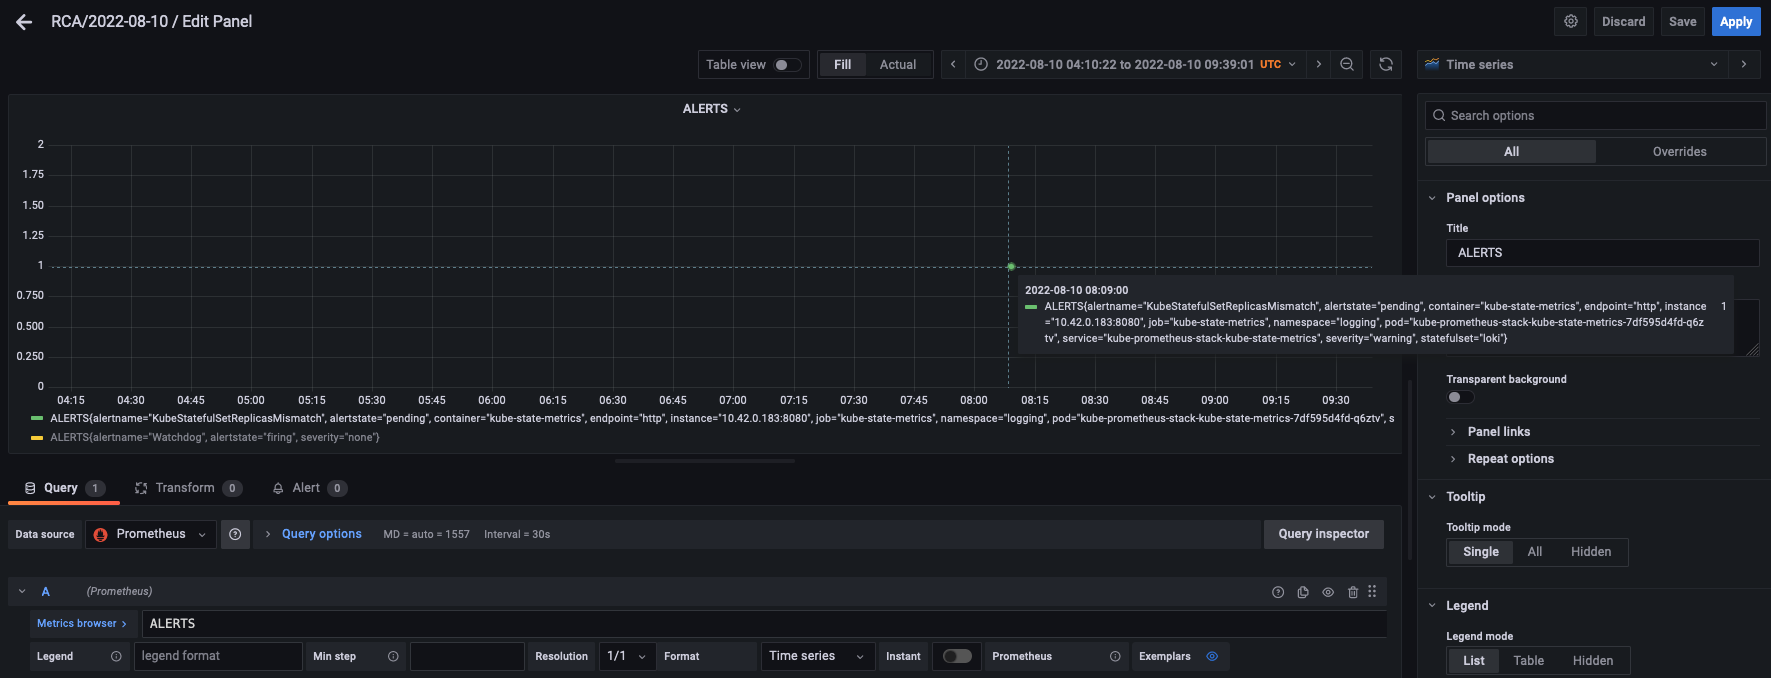
This is not that conforming. Basically there was only a single alert in the kubernetes-mixin, that were able to get to the pending state, but only after the incident was resolved.
Note: Take a note of the actual alert in
pending, it will be important later.
That’s not really on the alerts, though. We don’t know what was the actual issue with the node my site is running on, and since we lost the metrics, the alerts couldn’t really had a chance to alert me.
The (known) issue here is that I am running the complete monitoring stack on the same node/cluster my actual application is running too.
If there’s an outage bringing down my node, there’s a very good chance that
- I won’t be notified, as my monitoring stack is also broken
- I won’t be able to reconstruct the timeline of the incident, because (depending on the incident), there might be internal connectivity issues as well making in-cluster telemetry (if there’s any) unreliable.
So, an important lesson to learn here is that you should always have insights into your infrastructures from an external point of view.
In enterprise setups, this is rather easy (given you can pull it into the sprint :)): you can either leverage a 3rd party SaaS to handle this for you, or you can have an in-house solution, e.g. via a centralized observability platform.
In side-projects like this, it’s more complicated. Originally, I didn’t had this blindspot when I was running on Digital Ocean. DO had the features to configure resource based alerts, and IIRC you could set even those up to notifiy you in case of missing datapoints.
A solution like this would be great on Hetzner’s platform as well. Another thing that would be great if HC would have memory graphs on their web console. I am not sure how could it miss that one.
Anyway, Hetzner Cloud said it in their e-mail that the incident started at 7:49 UTC. After checking my metrics it turned out I had them go stale at 07:05:30.
This means that it was a bit more than 40m to notify the impacted users. That’s not that great, but it might be a bit better than what AWS were capable of on average during my time at LastPass.
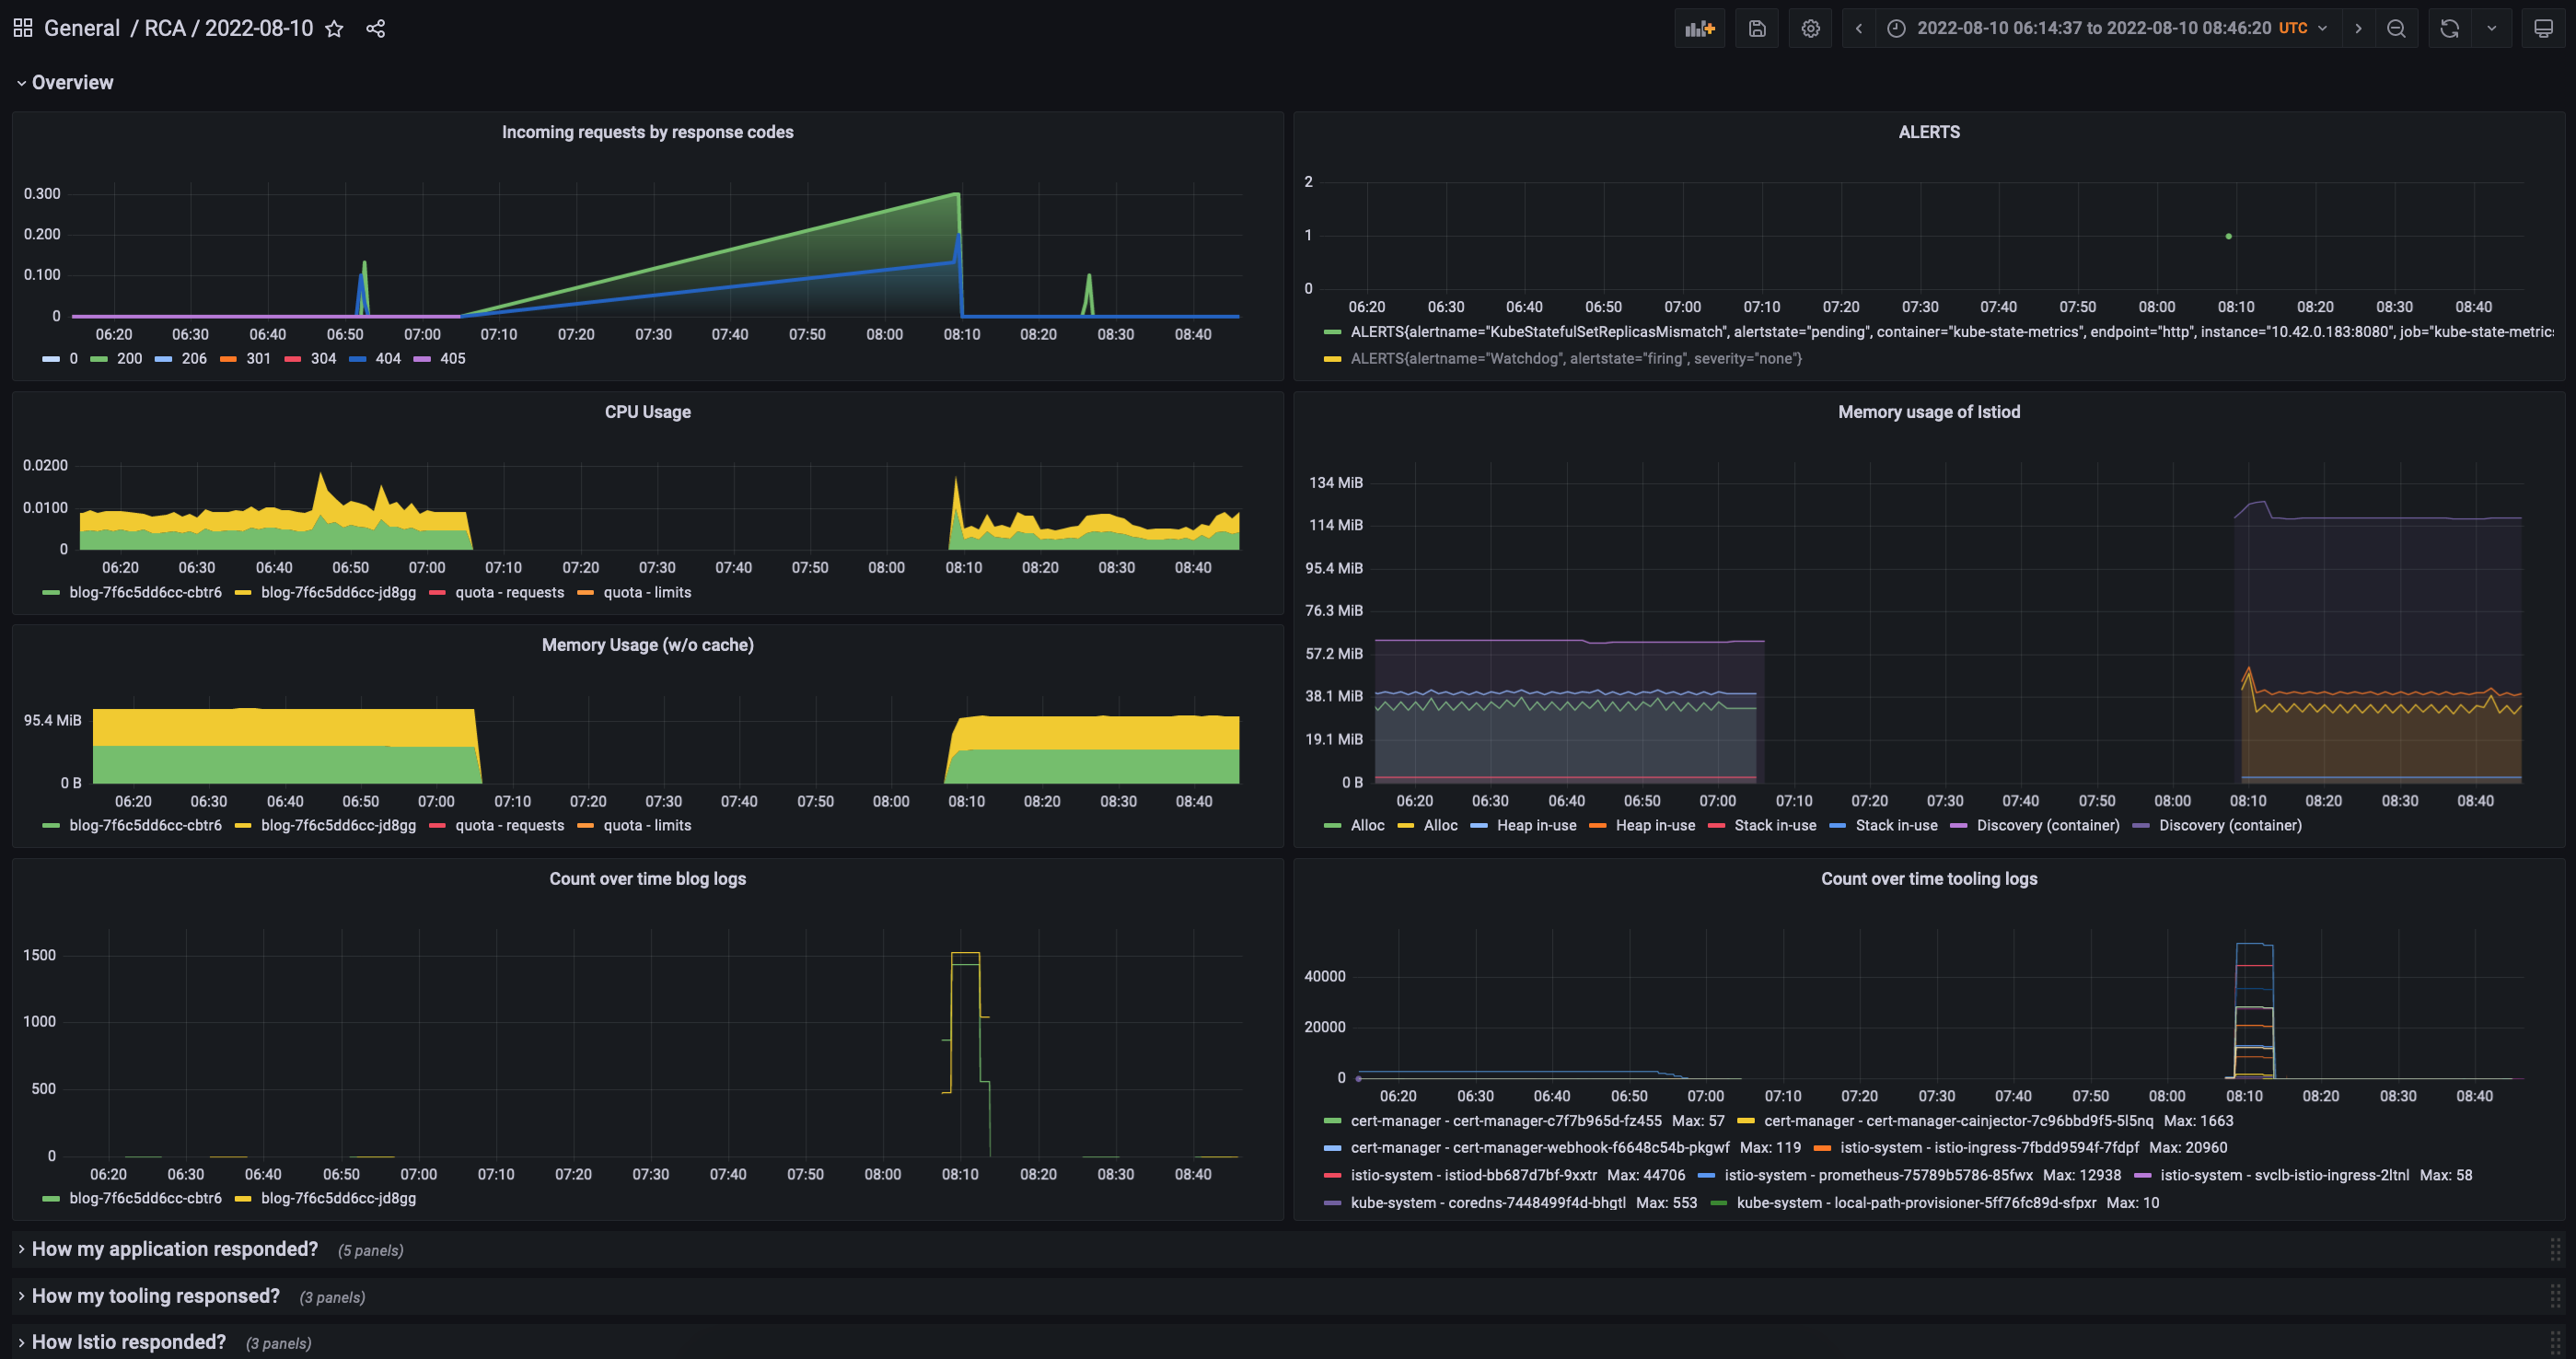
Checking any of my overview dashboards shows that I had an outage of some sort between 07:05:30 and 08:08:00.
I am using Splitbee (my only 3rd party service) to get some basic analytics. With the help of that I can state the following:
- I had my last successful visitor between 05:30 and 05:39 UTC
- I had my first successful visitor between 08:00 and 08:10 UTC
This confirms that after my monitoring stack started to work again, my site also started to work.
Hetzner Cloud sent me an email listing the following timeframe for the incident once it was resolved: Start: 2022-08-10 07:49 UTC+0 – Estimated end: 2022-08-10 13:03 UTC+0
It’s definitely possible that other VMs on this node were affected for longer (or shorter) time, but based on this, I can consider myself somewhat lucky.
How my application responded?
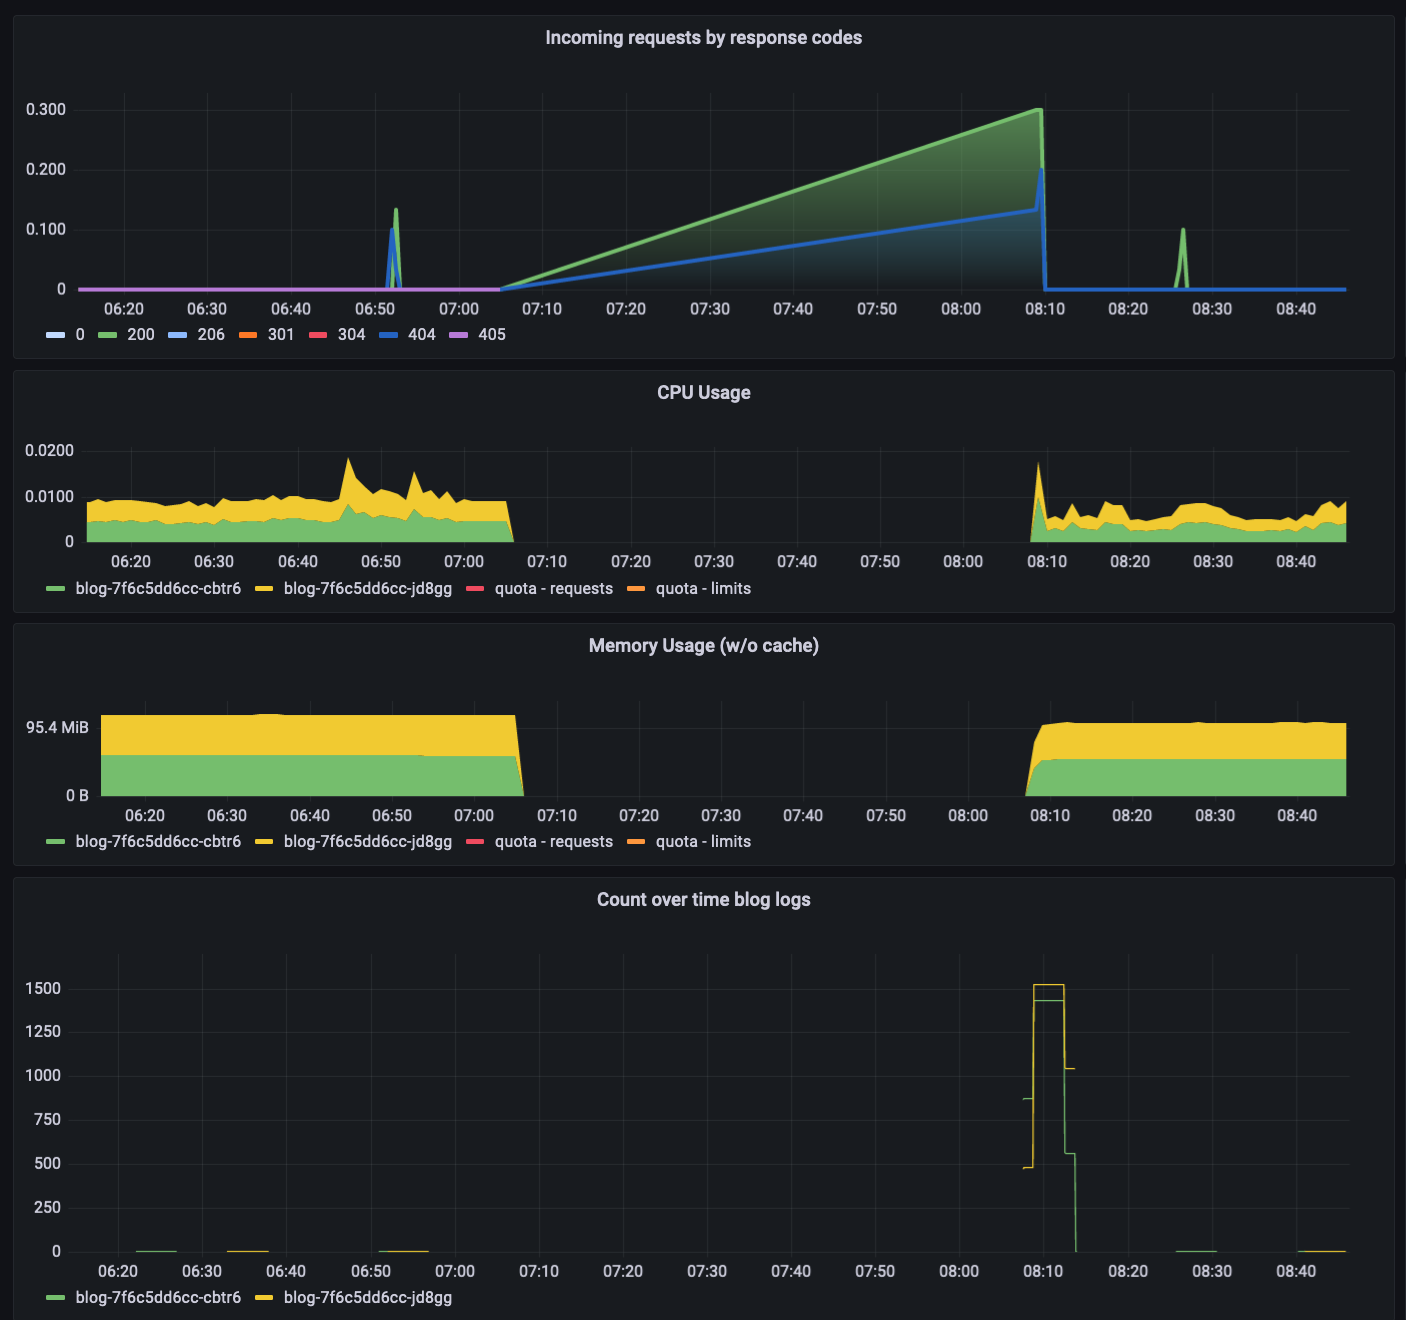
During the incident my website became unavailable, and since I lost my metrics during that timeframe, I have limited insights into its inner state.
As the root cause of the incident is the unavailability of the node my cluster was running on, the website didn’t produce high latency and/or elevated error rate. It just stopped working.
One thing I could do to mitigate this in the future, is to have a cluster distributed across multiple nodes (and optimally DCs), so pods running on a potentially healthy node could still serve my traffic.
Another solution would be to spin up a new cluster in a new DC during an incident. This would be a cheaper option, but it would require either more work upfront to automate it, or some manual intervention during an incident.
Luckily, I sort of have a business continuity plan as I performed dry-runs of spinning up a new replica of my blog. Since the operation takes less than a few minutes, it’s a good enough solution for me to mitigate an outage like this.
Checking the resource utilization and application graphs, the app self-healed itself after the live issue was resolved. There was a spike in terms of requests and logs, but these didn’t resulted in elevated resource usage, which is good.
How my tooling responded?
Regarding resource utilization, it was similar to my app.
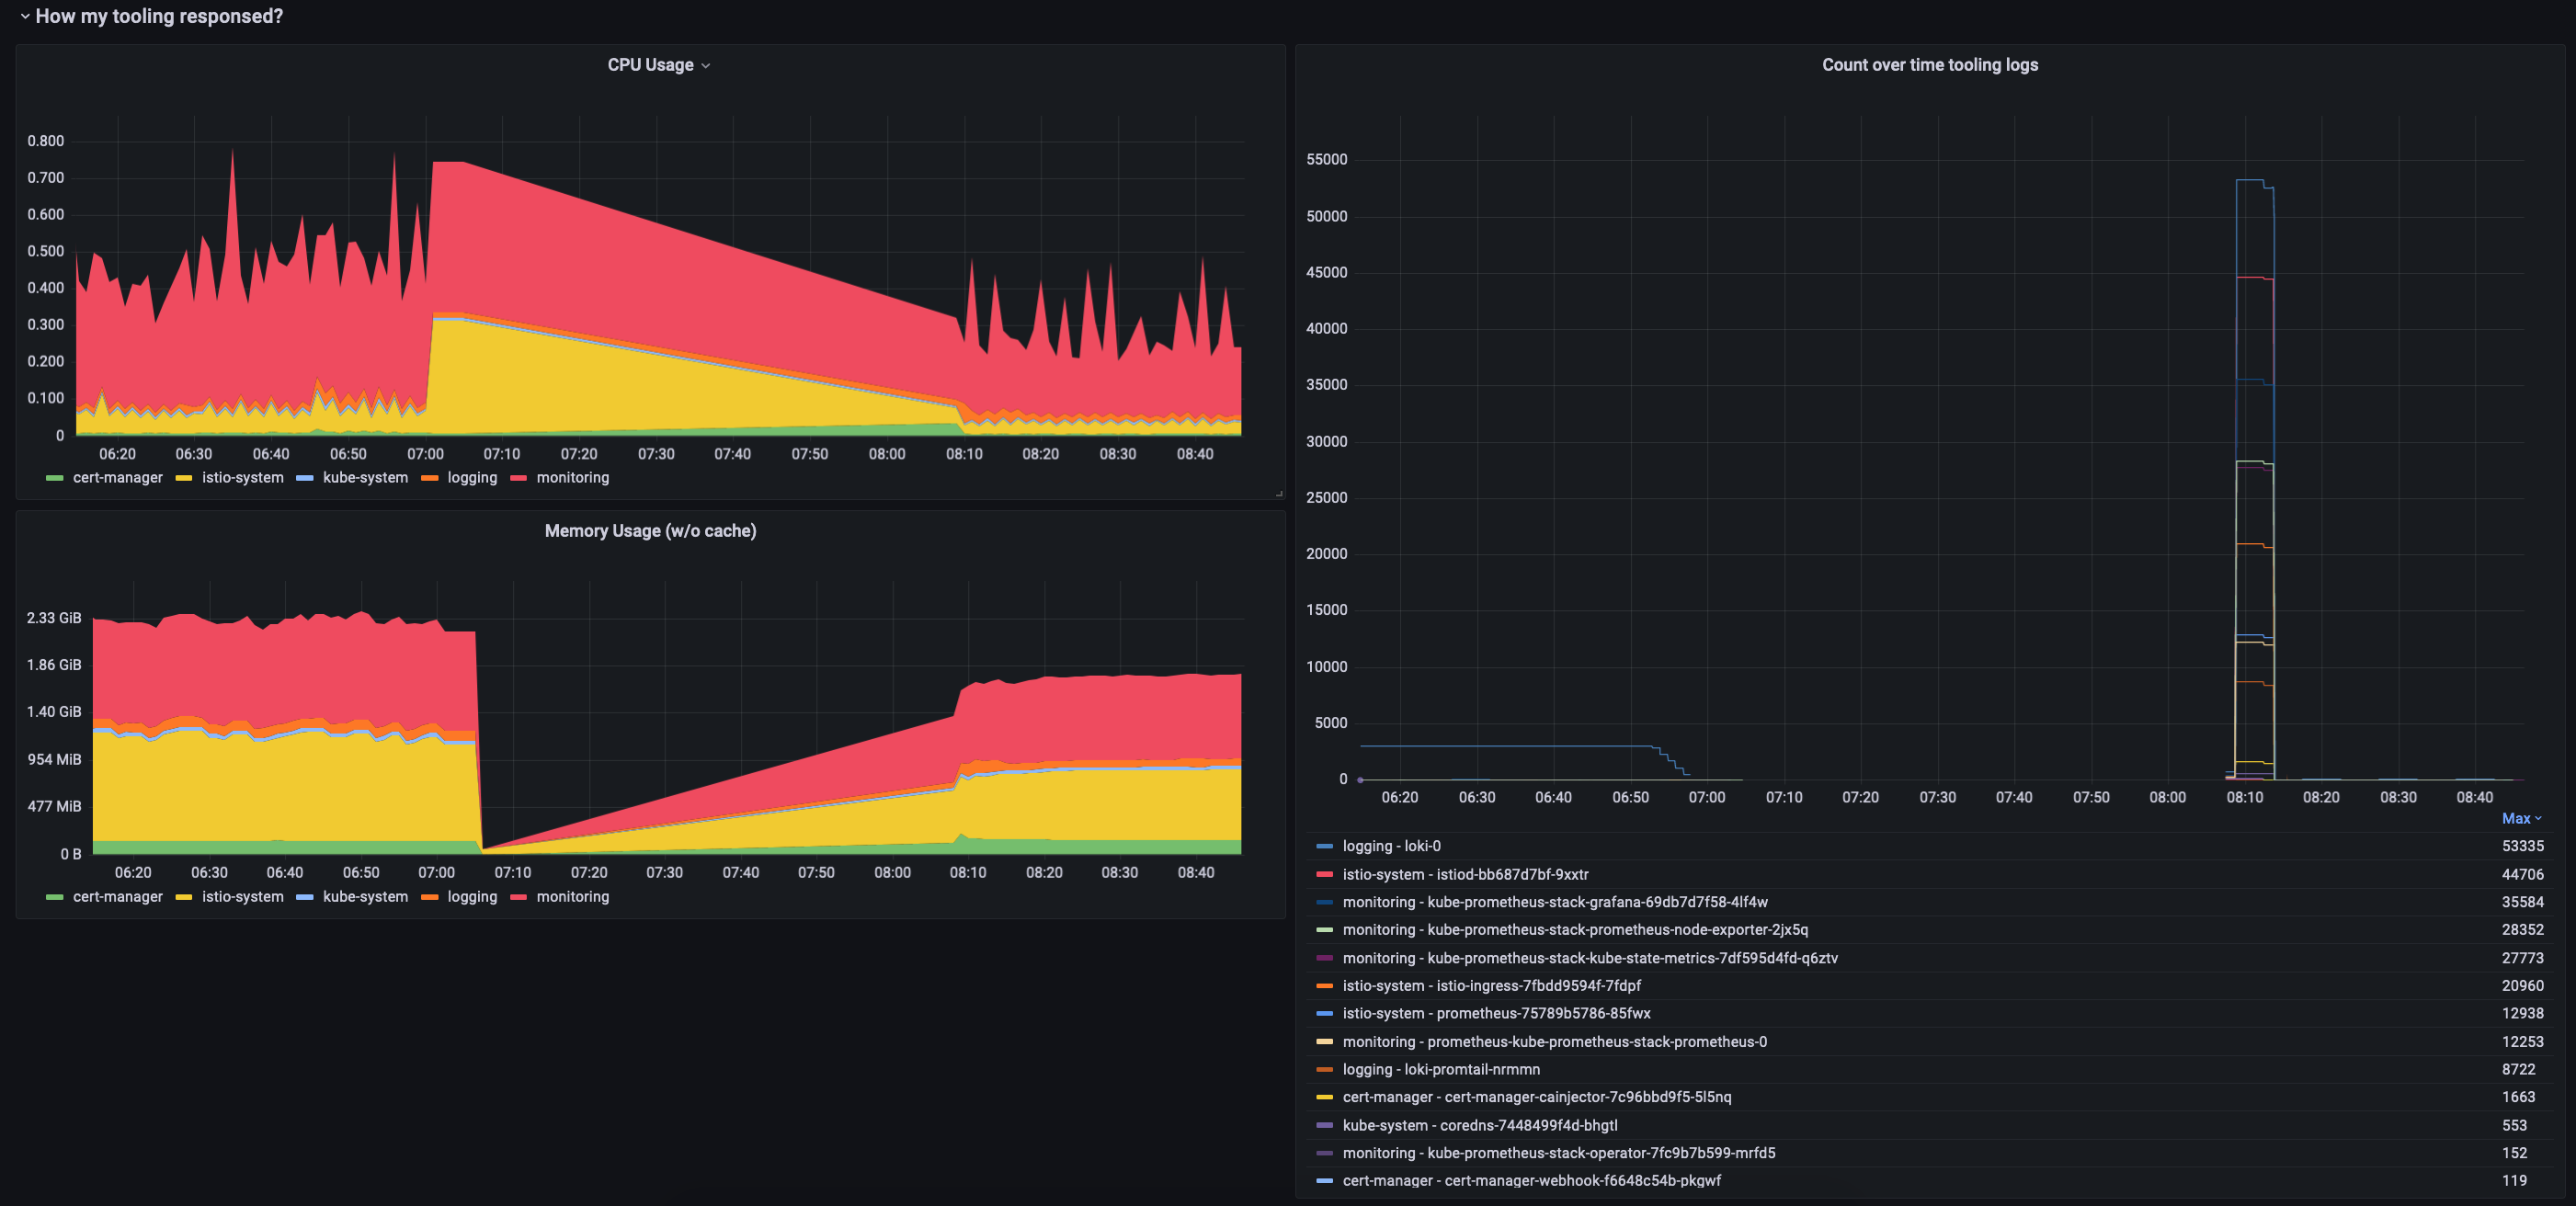
All of my tooling namespaces’ utilization went down to the level they were operating, or to an even lower level.
As you can see I had a huge amounts of logs when the node came back up, but Loki is quite performant, so my platform didn’t grind to halt.
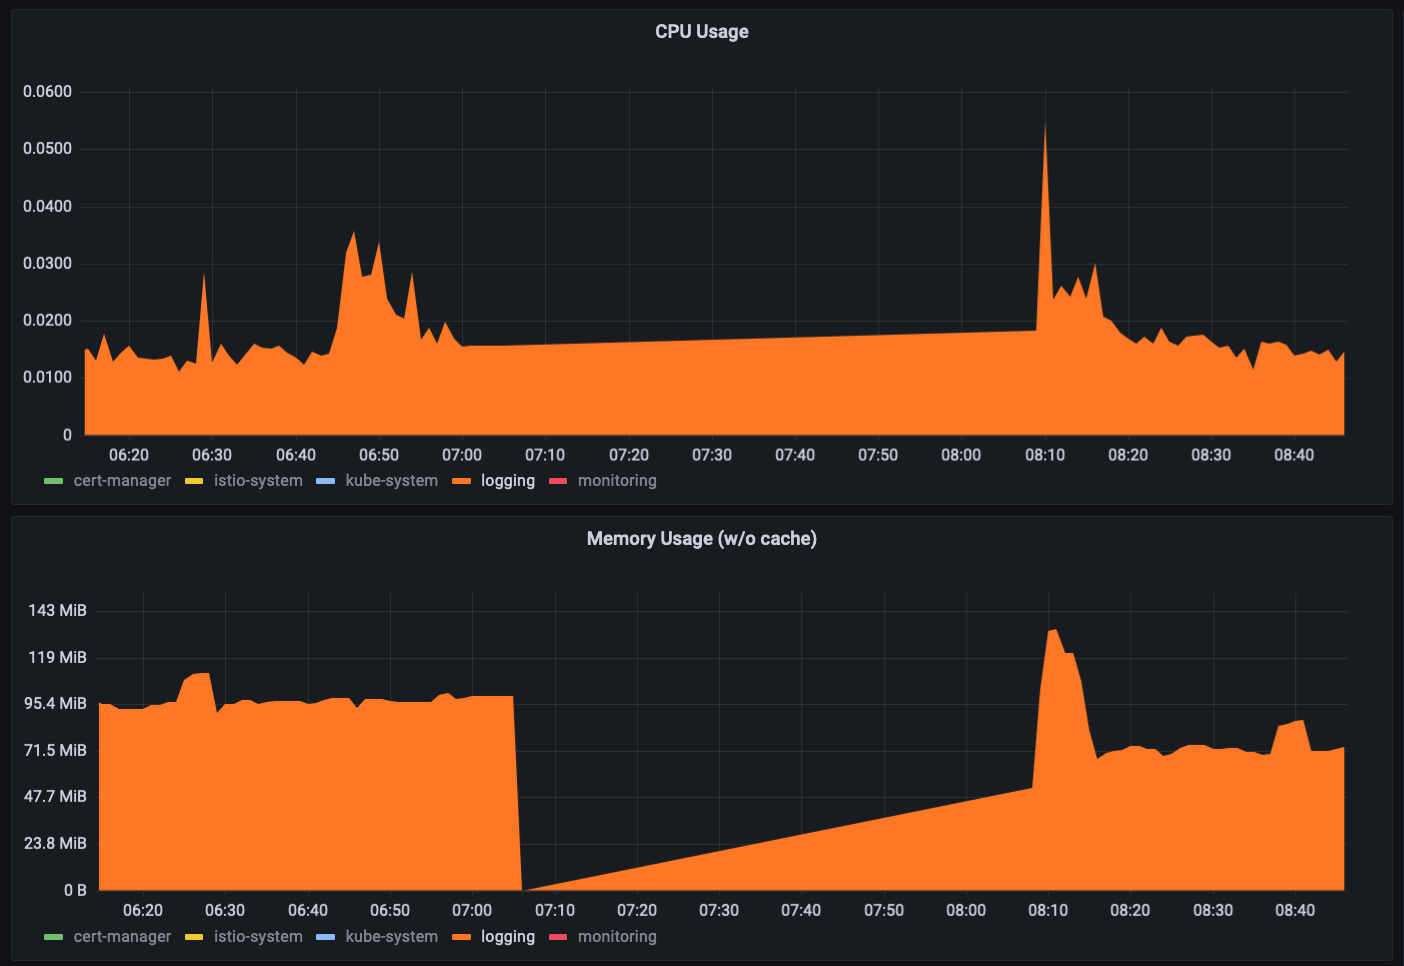
If we take a closer look at my logging namespace, we can see that Loki here experienced a higher CPU usage (not that scary), and memory usage. That’s expected as all of my workloads produced lots of logs during the recovery phase.
Or did they?
The graph above shows that loki-0 produced most of the logs. The second most came from Istio.
If we take a closer look at the Istio logs, it’s clear the something is off.

These events are originating from a different day!
That could definitely explain the high amount of logs better.
During the incident, my Loki seemingly tripped, and re-read log lines from an earlier point in time.
Remember the only alert that I got? Yes, Loki, again.
Let’s check the pod.
Containers:
  loki:
    Image:         grafana/loki:2.3.0
    Port:          3100/TCP
    Host Port:     0/TCP
    Args:
      -config.file=/etc/loki/loki.yaml
    State:          Running
      Started:      Wed, 10 Aug 2022 10:07:23 +0200
    Last State:     Terminated
      Reason:       Unknown
      Exit Code:    255
      Started:      Sun, 23 Jan 2022 11:34:35 +0100
      Finished:     Wed, 10 Aug 2022 10:07:09 +0200
    Ready:          True
    Restart Count:  3
We can check all the other pods, and we will see that all of them restarted at least once after the incident.
Has the VM been restarted? Let’s check it with a nice PromQL query:
(time() - node_boot_time_seconds) / 60 / 60 / 24
5.42274766203706
Graphing this will show that my uptime went down from xxx days to 5.4. That’s when the incident happened. It looks like they restarted the machine.
That’s not that bad as that’s something that can be easily reproduced. The issue is that other things might have also happened and those could make the repro attempts unreliable. It worth trying it out and see how the application behaves though. In fact, this should be covered during working on business continuity plan. One more action item for me.
Let’s get back to Loki.
I couldn’t find anything other than info logs for the loki-0 pod, and couldn’t catch anything suspicious by checking the loki_ metrics neither.
You can find the result of the following query in the upper left panel: sum(rate(loki_request_duration_seconds_count[5m])) by (route, method, status_code):

I checked the logs of my Promtail pod as well, and found multiple cases where Loki reached its rate-limiter’s boundery.
2022-08-10T08:08:42.178340249Z stderr F level=warn ts=2022-08-10T08:08:42.178226848Z caller=client.go:288 component=client host=loki:3100 msg="error sending batch, will retry" status=429 error="server returned HTTP status 429 Too Many Requests (429): Ingestion rate limit exceeded (limit: 4194304 bytes/sec) while attempting to ingest '5029' lines totaling '1048573' bytes, reduce log volume or contact your Loki administrator to see if the limit can be increased"
Fortunately, even with this huge amount of logs, my cluster was not overloaded, and it was able to recover completely by itself.
I will need to do some testing with my Loki setup to handle similar situations in the future. My Loki is also not the latest, so I can perform the tests with the new version as well to see how things have improved.
We could also see that, I had a momentary memory spike with a ~25% increase. It’s critical that you have proper container limits set to every one of your workloads, but this is especially true for your logging infrastructure. That includes both the forwarders and the destinations. A spike like this can be dangerous, because the oomkiller will come, and start massacring your pods. This doesn’t seem to be the case here, but it’s a good practice regardless. That’s a point I got right.
How Istio responded?
Let’s take a closer look at how my Istio setup handled the situation.
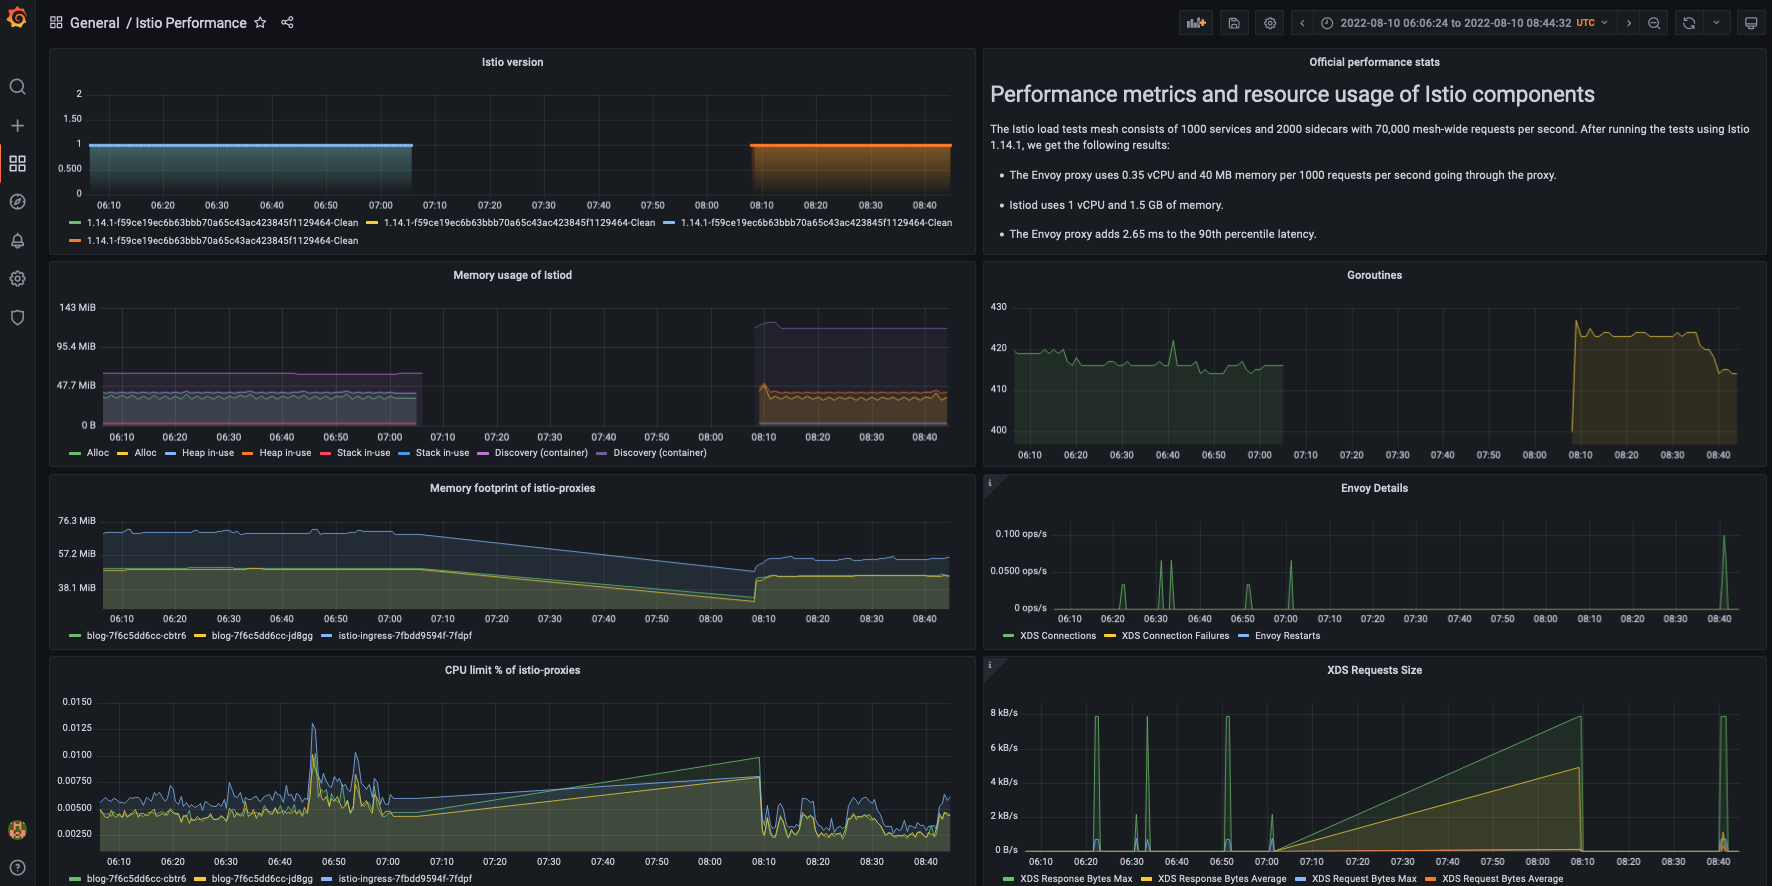
The memory usage of the Discovery container doubled!
Performing a rollout restart will clean this up. But what’s behind the increase?
Again, without knowing what was the underlying issue, it’s hard to pinpoint what could cause the increased memory usage.
Since I will try to reproduce the incident to see how Loki can be tuned, I can take also take a look at how Istio’s memory utilization will change.
What went well?
- The application and the metrics pipeline were able to handle the increased traffic during the recovery phase of the incident
- The resource request and limit values were set properly
What went wrong?
- I was only notified by the e-mail of my provider, which was late compared to when my site went offline
- I didn’t have 3rd party/cross-cluster monitoring
- Loki somehow tripped, re-reading (?) older log events
Where I got lucky?
- The outage only affected my blog for about an hour
- The nature of the outage and its resolution didn’t put more stress on my infrastructure
- Loki was affected, but it was still able to recover from ingesting a huge amount of older events
Action items
- Find an external monitoring solution
- Reproduce the machine reboot and check how Loki can recover
- Look into my Loki config, especially around he ingester limits and batch size
- Check how Istio’s Discovery container will be affected by the reboot test
Closing notes
Overall, this wasn’t that bad.
Once I fix the question of external monitoring, I will be able to spin up a new instance in a new datacenter under minutes during an outage like this.
Apart from this, I learned again that sensible defaults can make sense only until they didn’t, and finetuning is needed to make Loki more robust in situations like this.
It was nice to write an RCA again, and I am looking for the improvement I can implement after the wake of this incident.
Note: I will try to update the blog with my findings around Loki and Istio if I can successfully reproduce the behavior.
