Self-hosting Mastodon on NixOS, a proof-of-concept
Preface
Note: I will keep this section short, although I could easily write a much longer piece covering my thoughts on the social, engineering, and business aspects of what’s happening. Maybe next time, and I let this be a tech article.
With all that’s happening over Twitter, I (mostly) moved away from the platform. Currently I am planning to
- check on it from time to time
- not delete my user (to park my username)
- use it to share some news related to my day job, e.g. workshops, talks
In the meantime, I am also planning to
- not use it for anything other than that
- publish all sie project related posts on my new Mastodon account, @kfekete@hachyderm.io
- interact everyone on Mastodon instead of Twitter, if possible
I originally created my account on mastodon.social on Oct 30, 2022, but moved to hachyderm.social pretty soon due to the people joining that instance and the transparency I saw from @nova and her team.

In the same time, I also started to entertain the thought of self-hosting my own instance, mostly just for the sake of self-hosting a somewhat complex Ruby monolith.
Now, I am using my original user that is migrated to hachyderm.io, but I am also self-hosting my instance, which is in a proof-of-concept state at the moment.
With this article, I am aiming to document the work I did as part of this proof-of-concept, and share some thoughts on my first “production” experience with NixOS, Mastodon itself, observability, and on running a monolith in 2022.
Goals
I set the following goals for this project:
- use NixOS, so I can gain some production NixOS experience; that should be refreshing after spending most of my time in Kubernetes clusters
- add extensive observability to the components
- keep the configuration simple
- learn the basics of how Mastodon works and how it can break
Setting up a NixOS instance
I am running NixOS for some time now as my daily driver, and I really like it.
I should actually do a follow-up article on how my initial config evolved, and what my workflow looks like.
As I mentioned, I wanted to get experienced running it in a prod environment, so I purchased a machine over Hetzner. This is a quite small (cx21, 2vCPU, 4GB RAM) instance, but after running it for two weeks, it seems to be the perfect size for hosting two accounts that are not really doing anything.
I found leveraging nix-infect to be the fastest way to turn a Hetzner machine into NixOS, so I used that. For this, you need to inject the script as cloud-init when you are creating your instance. The infection will kick in after a few seconds the server is created, and you have a NixOS machine up & running.
I use Terraform to spin up instances of my blog, so it would be fairly straightforward to create a module to provision NixOS machines as well. If I want to get serious with self-hosting my instance, I should look into all the variable options to operate and manage remote NixOS hosts, but for this PoC, my current punk approach is fine.
Mastodon, and how it’s managed as part of nixpkgs
My initial Mastodon config was originally this exact snippet:
  services.mastodon = {
   enable = true;
   localDomain = "social.krisztianfekete.org";
   configureNginx = true;
   smtp.fromAddress = "";
 };

 security.acme = {
   acceptTerms = true;
   defaults.email = "<REDACTED>";
 };
I had to set up my DNS records for this machine, but this got me a working instance, as in I was able to visit social.krisztianfekete.org, and register an account.
As you would imagine, this simple config hides most of the underlying complexity of the Mastodon services.
This is a tl;dr: of how Mastodon works:
- There’s NGINX serving as the proxy to interact with Mastodon from the outside
- There’s a Puma webserver (mastodon-web) to serve short-lived API requests, and there’s a NodeJs webserver (mastodon-streaming) to handle long-lived requests and WebSockets
- There’s a Ruby on Rails backend that is using a file storage for all the media files
- There’s a PostgreSQL database, this hosts all the profiles, toots (posts)
- There’s Sidekiq for background job processing
- There’s a Redis to cache the various feeds you have, and Sidekiq also uses it
That’s a lot of services, and it’s quite nice that you can get all this set up with <10 lines of code. You can browse the actual code of the Mastodon nixpkgs to see how your config gets generated.
I didn’t have to change most of the config seen above, but I did migrate to self-hosting NGINX service to have more control over it. I did this to use a custom log_format to enhance my Loki based logging setup, but more on this later.
Taking control over NGINX
If you take a look at the code of the Mastodon package, you will get some insights on what’s happening if you enable configureNginx.
It’s good to take an actual look at the config NGINX is running with, so we can compare the before/after config once the migration is down.
To do this, let’s find the config file first. Since this is NixOS, you cannot just grab it from /etc/nginx.
Instead of that, check the service’s status first with systemctl status nginx.service
● nginx.service - Nginx Web Server
     Loaded: loaded (/etc/systemd/system/nginx.service; enabled; vendor preset: enabled)
     Active: active (running) since Fri 2022-12-02 16:38:47 UTC; 2 days ago
    Process: 176993 ExecReload=/nix/store/qw81ghsfrf7dfn20gvmkbn90m5icswcq-nginx-1.22.1/bin/nginx -c /nix/store/4gsldd320rg7mg4qrl7c4v2l56jqjcd3-nginx.conf -t (code=exited, status=0/SUCC>
    Process: 176994 ExecReload=/nix/store/kgllqqq7gjwxn8ifhkhb321855cskks4-coreutils-9.0/bin/kill -HUP $MAINPID (code=exited, status=0/SUCCESS)
   Main PID: 153262 (nginx)
         IP: 5.0M in, 42.7M out
         IO: 3.0M read, 8.6M written
      Tasks: 2 (limit: 4585)
     Memory: 8.7M
        CPU: 14.279s
     CGroup: /system.slice/nginx.service
             ├─153262 "nginx: master process /nix/store/qw81ghsfrf7dfn20gvmkbn90m5icswcq-nginx-1.22.1/bin/nginx -c /nix/store/4gsldd320rg7mg4qrl7c4v2l56jqjcd3-nginx.conf"
             └─176995 "nginx: worker process"

Dec 05 04:02:34 mastohost systemd[1]: Reloading Nginx Web Server...
Dec 05 04:02:34 mastohost nginx[176993]: nginx: the configuration file /nix/store/4gsldd320rg7mg4qrl7c4v2l56jqjcd3-nginx.conf syntax is ok
Dec 05 04:02:34 mastohost nginx[176993]: nginx: configuration file /nix/store/4gsldd320rg7mg4qrl7c4v2l56jqjcd3-nginx.conf test is successful
Dec 05 04:02:35 mastohost systemd[1]: Reloaded Nginx Web Server.
Now, you see where it’s loading the configuration from, so we can take a look at the content of the file.
# cat /nix/store/4gsldd320rg7mg4qrl7c4v2l56jqjcd3-nginx.conf
pid /run/nginx/nginx.pid;
error_log stderr;
daemon off;
events {
}
http {
	# The mime type definitions included with nginx are very incomplete, so
	# we use a list of mime types from the mailcap package, which is also
	# used by most other Linux distributions by default.
	include /nix/store/a2ckhxhp7gmmf3zwxg2i7vsk93q7vrpn-mailcap-2.1.53/etc/nginx/mime.types;
	# When recommendedOptimisation is disabled nginx fails to start because the mailmap mime.types database
	# contains 1026 enries and the default is only 1024. Setting to a higher number to remove the need to
	# overwrite it because nginx does not allow duplicated settings.
	types_hash_max_size 4096;
	include /nix/store/qw81ghsfrf7dfn20gvmkbn90m5icswcq-nginx-1.22.1/conf/fastcgi.conf;
	include /nix/store/qw81ghsfrf7dfn20gvmkbn90m5icswcq-nginx-1.22.1/conf/uwsgi_params;
	default_type application/octet-stream;
	ssl_protocols TLSv1.2 TLSv1.3;
	ssl_ciphers ECDHE-ECDSA-AES128-GCM-SHA256:ECDHE-RSA-AES128-GCM-SHA256:ECDHE-ECDSA-AES256-GCM-SHA384:ECDHE-RSA-AES256-GCM-SHA384:ECDHE-ECDSA-CHACHA20-POLY1305:ECDHE-RSA-CHACHA20-POLY1305:DHE-RSA-AES128-GCM-SHA256:DHE-RSA-AES256-GCM-SHA384;
	proxy_redirect          off;
	proxy_connect_timeout   60s;
	proxy_send_timeout      60s;
	proxy_read_timeout      60s;
	proxy_http_version      1.1;
	include /nix/store/7y7808pn4hsypszdvc7nnxr645ag37ff-nginx-recommended-proxy-headers.conf;
	# $connection_upgrade is used for websocket proxying
	map $http_upgrade $connection_upgrade {
		default upgrade;
		''      close;
	}
	client_max_body_size 10m;
	server_tokens off;
	server {
		listen 0.0.0.0:80 ;
		listen [::0]:80 ;
		server_name social.krisztianfekete.org ;
		location /.well-known/acme-challenge {
			root /var/lib/acme/acme-challenge;
			auth_basic off;
		}
		location / {
			return 301 https://$host$request_uri;
		}
	}
	server {
		listen 0.0.0.0:443 http2 ssl ;
		listen [::0]:443 http2 ssl ;
		server_name social.krisztianfekete.org ;
		location /.well-known/acme-challenge {
			root /var/lib/acme/acme-challenge;
			auth_basic off;
		}
		root /nix/store/yjhhdl6n9pbn83yd9n99jp7ran0rifi1-mastodon-3.5.5/public/;
		ssl_certificate /var/lib/acme/social.krisztianfekete.org/fullchain.pem;
		ssl_certificate_key /var/lib/acme/social.krisztianfekete.org/key.pem;
		ssl_trusted_certificate /var/lib/acme/social.krisztianfekete.org/chain.pem;
		location / {
			try_files $uri @proxy;
		}
		location /api/v1/streaming/ {
			proxy_pass http://unix:/run/mastodon-streaming/streaming.socket;
			proxy_http_version 1.1;
			proxy_set_header Upgrade $http_upgrade;
			proxy_set_header Connection $connection_upgrade;
			include /nix/store/7y7808pn4hsypszdvc7nnxr645ag37ff-nginx-recommended-proxy-headers.conf;
		}
		location /system/ {
			alias /var/lib/mastodon/public-system/;
		}
		location @proxy {
			proxy_pass http://unix:/run/mastodon-web/web.socket;
			proxy_http_version 1.1;
			proxy_set_header Upgrade $http_upgrade;
			proxy_set_header Connection $connection_upgrade;
			include /nix/store/7y7808pn4hsypszdvc7nnxr645ag37ff-nginx-recommended-proxy-headers.conf;
		}
	}
}
To have a very similar config generated, you can do something like this after disabling configureNginx:
  services.nginx = {
    enable = true;
    recommendedProxySettings = true;
    recommendedTlsSettings = true;

    # Enhanced access logs
    commonHttpConfig = ''
      log_format with_response_time '$remote_addr - $remote_user [$time_local] '
                   '"$request" $status $body_bytes_sent '
                   '"$http_referer" "$http_user_agent" '
                   '"$request_time" "$upstream_response_time"';
      access_log /var/log/nginx/access.log with_response_time;
    '';

    virtualHosts."social.krisztianfekete.org" = {
      enableACME = true;
      forceSSL = true;

      locations."/.well-known/acme-challenge/" = {
        root = "/var/lib/acme/acme-challenge";
        extraConfig = ''
          auth_basic off;
        '';
      };

      root = "${config.services.mastodon.package}/public/";

      locations."/system/".alias = "/var/lib/mastodon/public-system/";

      locations."/" = {
        tryFiles = "$uri @proxy";
      };

      locations."@proxy" = {
        proxyPass = "http://unix:/run/mastodon-web/web.socket";
        proxyWebsockets = true;
      };

      locations."/api/v1/streaming/" = {
        proxyPass = "http://unix:/run/mastodon-streaming/streaming.socket";
        proxyWebsockets = true;
      };
    };
  };
This can serve as a good starting point, but NGINX is highly customizable and optimizable, so once I have proper observability in place, I can start to tune this to achieve better performance. There’s only a few things better than being able to use signals to optimize performance and then validate these with the metrics.
I had two notable projects at LastPass that involved tuning NGINX, and for the second time I was able to experiment much faster and in a more educated manner due to having better metrics for NGINX itself. Adding those metrics turned out to be of one the highest ROI ideas, as they decreased latency spikes by ~85% in p95 during peak hours. It took maybe 2 days to add them, and roll them out in production.
Setting up the metrics pipeline
Prometheus is a central piece to the observability layer I added, so let’s take a look at how this works.
I am using a fairly simple setup where I have a Grafana attached to my Prometheus, that is being powered by various exporters, such as node-exporter, postgres-exporter, redis-exporter, statsd-exporter, and blackbox-exporter.
 # Observability tooling
 ## Prometheus
  services.prometheus = {
    enable = true;
    port = 9090;

    extraFlags = [
      "--storage.tsdb.retention.time=168h"
    ];

    exporters = {
      node = {
        enable = true;
        enabledCollectors = [ "systemd" ];
        port = 9100;
      };
      postgres = {
        enable = true;
        port = 9187;
        runAsLocalSuperUser = true;
        extraFlags = [ "--auto-discover-databases" ];
      };
      redis = {
        enable = true;
        port = 9121;
        extraFlags = [ "--redis.addr=127.0.0.1:${toString config.services.mastodon.redis.port}" ];
      };
      blackbox = {
        enable = true;
        configFile = pkgs.writeText "config.yaml"
          ''
            modules:
              http_2xx:
                prober: http
                timeout: 5s
                http:
                  valid_http_versions: ["HTTP/1.1", "HTTP/2.0"]
                  valid_status_codes: []  # Defaults to 2xx
                  method: GET
                  headers:
                    Host: social.krisztianfekete.org
                  no_follow_redirects: false
                  fail_if_ssl: false
            #...
            #...
            #...
          '';
        };
      };
    }; # prometheus.exporters
  }; # services.prometheus
Nothing really interesting here, but notice how you can reference config specified earlier to make them easier to manage by following DRY principles, e.g.:
extraFlags = [ "--redis.addr=127.0.0.1:${toString config.services.mastodon.redis.port}" ];
The only exporter that required a bit more advanced configuration was the statsd-exporter, because it’s not part of this upstream exporters collection at the moment of writing.
Currently, I am running it like this:
  systemd.services."prometheus-statsd-exporter" = let
    configFile = pkgs.writeText "config.yaml"
      ''
        mappings:
          ## Web collector
          - match: Mastodon\.production\.web\.(.+)\.(.+)\.(.+)\.status\.(.+)
            match_type: regex
            name: "mastodon_controller_status"
            labels:
              controller: $1
              action: $2
              format: $3
              status: $4
              mastodon: "web"
          #...
          #...
          #...
      '';
    in {
    wantedBy = [ "multi-user.target" ];
    requires = [ "network.target" ];
    after = [ "network.target" ];
    script = ''
      exec ${pkgs.prometheus-statsd-exporter}/bin/statsd_exporter --statsd.listen-tcp=":9125" --web.listen-address=":9102" --statsd.mapping-config=${configFile}
      '';
    };
The systemd configuration could be more polished, but for the PoC it’s fine as is. I might contribute this exporter to the upstream collection to make this easier to use, once time permits.
Notice how I am generating the inline config, so I can get away with having a single configuration.nix for the PoC phase.
For the mappings, I am leveraging the great work of IPngNetworks described here.
All this gets visualized in Grafana. The configuration for that component is quite simple.
  services.grafana = {
    enable = true;
    port = 3000;

    provision = {
      enable = true;
      datasources = [
        {
          name = "Prometheus";
          type = "prometheus";
          access = "proxy";
          url = "http://localhost:${toString config.services.prometheus.port}";
          isDefault = true;
        }
        {
          name = "Loki";
          type = "loki";
          access = "proxy";
          url = "http://127.0.0.1:${toString config.services.loki.configuration.server.http_listen_port}";
        }
      ];
      dashboards = [
        {
          name = "Prometheus / Overview";
          options.path = ./grafana/dashboards/prometheus.json;
        }
        {
          name = "Node Exporter Full";
          options.path = ./grafana/dashboards/nodeexporter.json;
        }
      ];
    };
  };
The only slightly interesting detail is how I am provisioning the datasources and dashboards from code.
I omitted certain (mostly redundant) section of the code again, to keep this post relatively short and easy to digest.
Setting up the logging pipeline
Setting up logging with my goto stack was trivial. I am using Loki and Promtail for more than a year now under my blog and I have used it a bit at my previous job as well, but this is the first time I am using it on a bare-virtual/systemd machine.
Compared to the Prometheus stack, that I started to use on VMs in ~2016 and managed it with Ansible and Puppet since that in production at scale.
This is a simplified version of my logging stack:
 # Logging pipeline
 ## Loki
  services.loki = {
    enable = true;
    configuration = {
      server.http_listen_port = 3100;
      auth_enabled = false;

      querier = {
        max_concurrent = 2048;
        query_ingesters_within = 0;
      };
      query_scheduler = {
        max_outstanding_requests_per_tenant = 2048;
      };

      ingester = {
        lifecycler = {
          address = "127.0.0.1";
          ring = {
            kvstore = {
              store = "inmemory";
            };
            replication_factor = 1;
          };
        };
      };
      #...
      #...
      #...
    };
  };
Most of the config is redacted, but this example should give you some idea about what it’s like to use nix to configure Loki. you can use the upstream docs to get more info on how to configure Loki.
This is my personal opinion, but after tuning this config a few times, I think it’s faster and more portable to use the native config files and ditch nix for this purpose, so you can get away with something like this:
  services.loki = {
    enable = true;
    configFile = ./loki.yaml;
  };
The source of Loki is Promtail, and I have it has a configuration similar to this:
  services.promtail = {
    enable = true;
    configuration = {
      server = {
        http_listen_port = 9080;
      };
      positions = {
        filename = "/tmp/positions.yaml";
      };
      clients = [{
        url = "http://127.0.0.1:${toString config.services.loki.configuration.server.http_listen_port}/loki/api/v1/push";
      }];
      scrape_configs = [
        {
          job_name = "journal";
          journal = {
            max_age = "12h";
            labels = {
              job = "systemd-journal";
              host = config.networking.hostName;
            };
          };
          relabel_configs = [{
            source_labels = [ "__journal__systemd_unit" ];
            target_label = "unit";
          }];
         }
         {
          job_name = "nginx";
          static_configs = [
            {
              targets = [
                "127.0.0.1"
              ];
              labels = {
                job = "nginx";
                host = config.networking.hostName;
                __path__ = "/var/log/nginx/*.log";
              };
            }
          ];
         }
      ];
    }; # promtail.configuration
  }; # services.promtail
It’s almost a year since since I last operated anything other than Kubernetes clusters, so it was a good reminder how much is abstracted away from us nowadays.
After the first try, I got this error from Promtail:
Nov 24 13:14:57 mastohost systemd[1]: Started Promtail log ingress.
Nov 24 13:14:57 mastohost promtail[55167]: level=info ts=2022-11-24T13:14:57.463099057Z caller=server.go:260 http=[::]:3031 grpc=[::]:38725 msg="server listening on addresses"
Nov 24 13:14:57 mastohost promtail[55167]: level=info ts=2022-11-24T13:14:57.463841846Z caller=main.go:119 msg="Starting Promtail" version="(version=2.5.0, branch=unknown, revision=unknown)"
Nov 24 13:15:02 mastohost promtail[55167]: level=info ts=2022-11-24T13:15:02.46937454Z caller=filetargetmanager.go:328 msg="Adding target" key="/var/log/nginx/*.log:{host=\"mastohost\", job=\"nginx\"}"
My target was recognized, but I could not see the logs in Grafana. What could be missing?
File permissions. That’s not something you frequently encounter when working with Kubernetes.
Granting access to the files fixed the issue immediately:
users.users.promtail.extraGroups = [ "nginx" ];
Better logs for Promtail would be better, I am not sure setting the verbosity to another level is more useful, I did not check.
Alerting
Then, you need alerting, of course.
Alertmanager is a great fit for this due to the excellent integrations with receivers, webhooks, and the Prometheus ecosystem itself.
This is a simplified version of the config I have, only listing three alerts across two groups:
  services.prometheus = {
    alertmanager.enable = true;
    alertmanager.extraFlags = [
      "--cluster.listen-address=" # empty string disables HA mode
    ];

    alertmanager.configText = ''
      route:
        group_wait: 10s
        group_by: ['alertname']
        receiver: telegram
      receivers:
      - name: telegram
        webhook_configs:
        - send_resolved: true
          url: 'REDACTED'
    '';

    alertmanagers = [
      {
         scheme = "http";
         path_prefix = "/";
         static_configs = [{targets = ["127.0.0.1:${toString config.services.prometheus.alertmanager.port}"];}];
      }
    ];

    rules = let
      diskCritical = 10;
      diskWarning = 20;
    in [
      (builtins.toJSON {
        groups = [
          {
            name = "alerting-pipeline";
            rules = [
              {
                alert = "DeadMansSnitch";
                expr = "vector(1)";
                labels = {
                  severity = "critical";
                };
                annotations = {
                  summary = "Alerting DeadMansSnitch.";
                  description = "This is an alert meant to ensure that the entire alerting pipeline is functional.";
                };
              }
            ];
          }
          {
            name = "mastodon";
            rules = [
              {
                alert = "SystemDUnitDown";
                expr = ''node_systemd_unit_state{state="failed"} == 1'';
                annotations = {
                  summary = "{{$labels.instance}} failed to (re)start the following service {{$labels.name}}.";
                };
              }
              {
                alert = "RootPartitionFull";
                for = "10m";
                expr = ''(node_filesystem_free_bytes{mountpoint="/"} * 100) / node_filesystem_size_bytes{mountpoint="/"} < ${toString diskWarning}'';
                annotations = {
                  summary = ''{{ $labels.job }} running out of space: {{ $value | printf "%.2f" }}% < ${toString diskWarning}%'';
                };
              }
            ];
          }
        ];
      })
    ];
  };
I am planning to add all the alerts from various mixins for the components I am observing and once my Mastodon Operational Dashboard is ready, I will specify alerts based on that as well.
What I have now
I enjoyed putting all these together, it was really refreshing to work with NixOS on an instance other than my laptop. I am obviously not running this at scale, but I found it surprisingly easy to get my instance to this state starting from scratch basically.
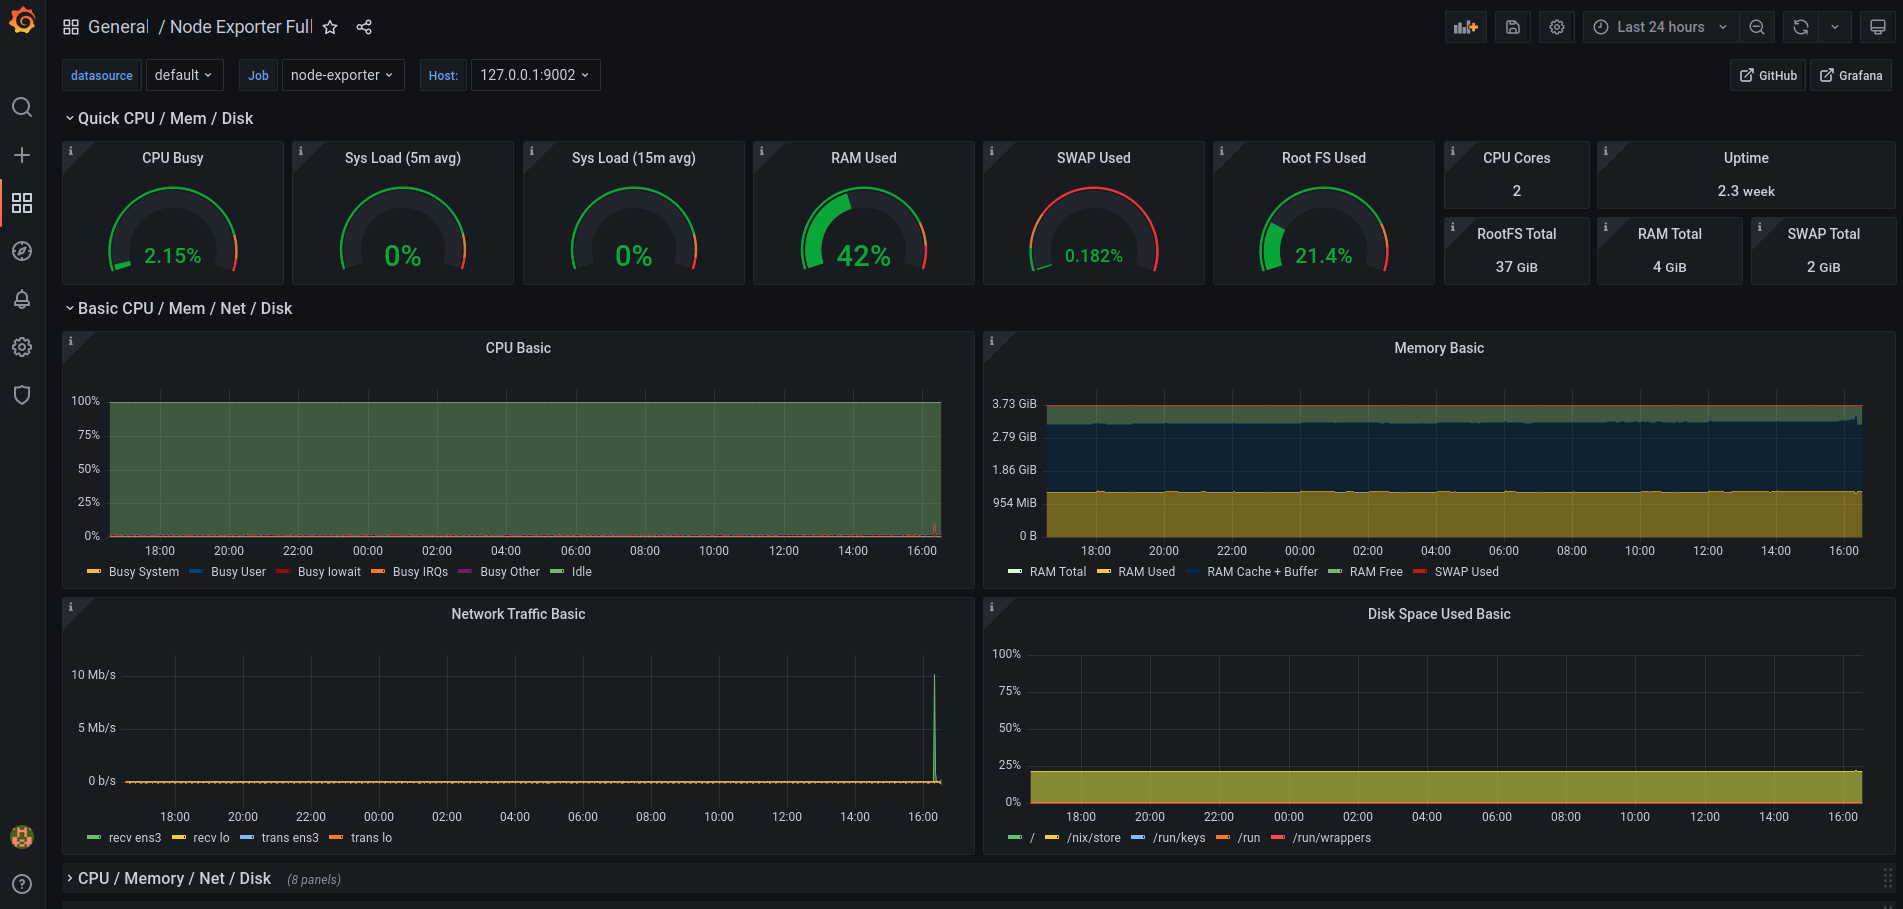
I am also pleasantly surprised by the low resource usage. Most of the time I am using <10% of CPU and ~40% of RAM only.
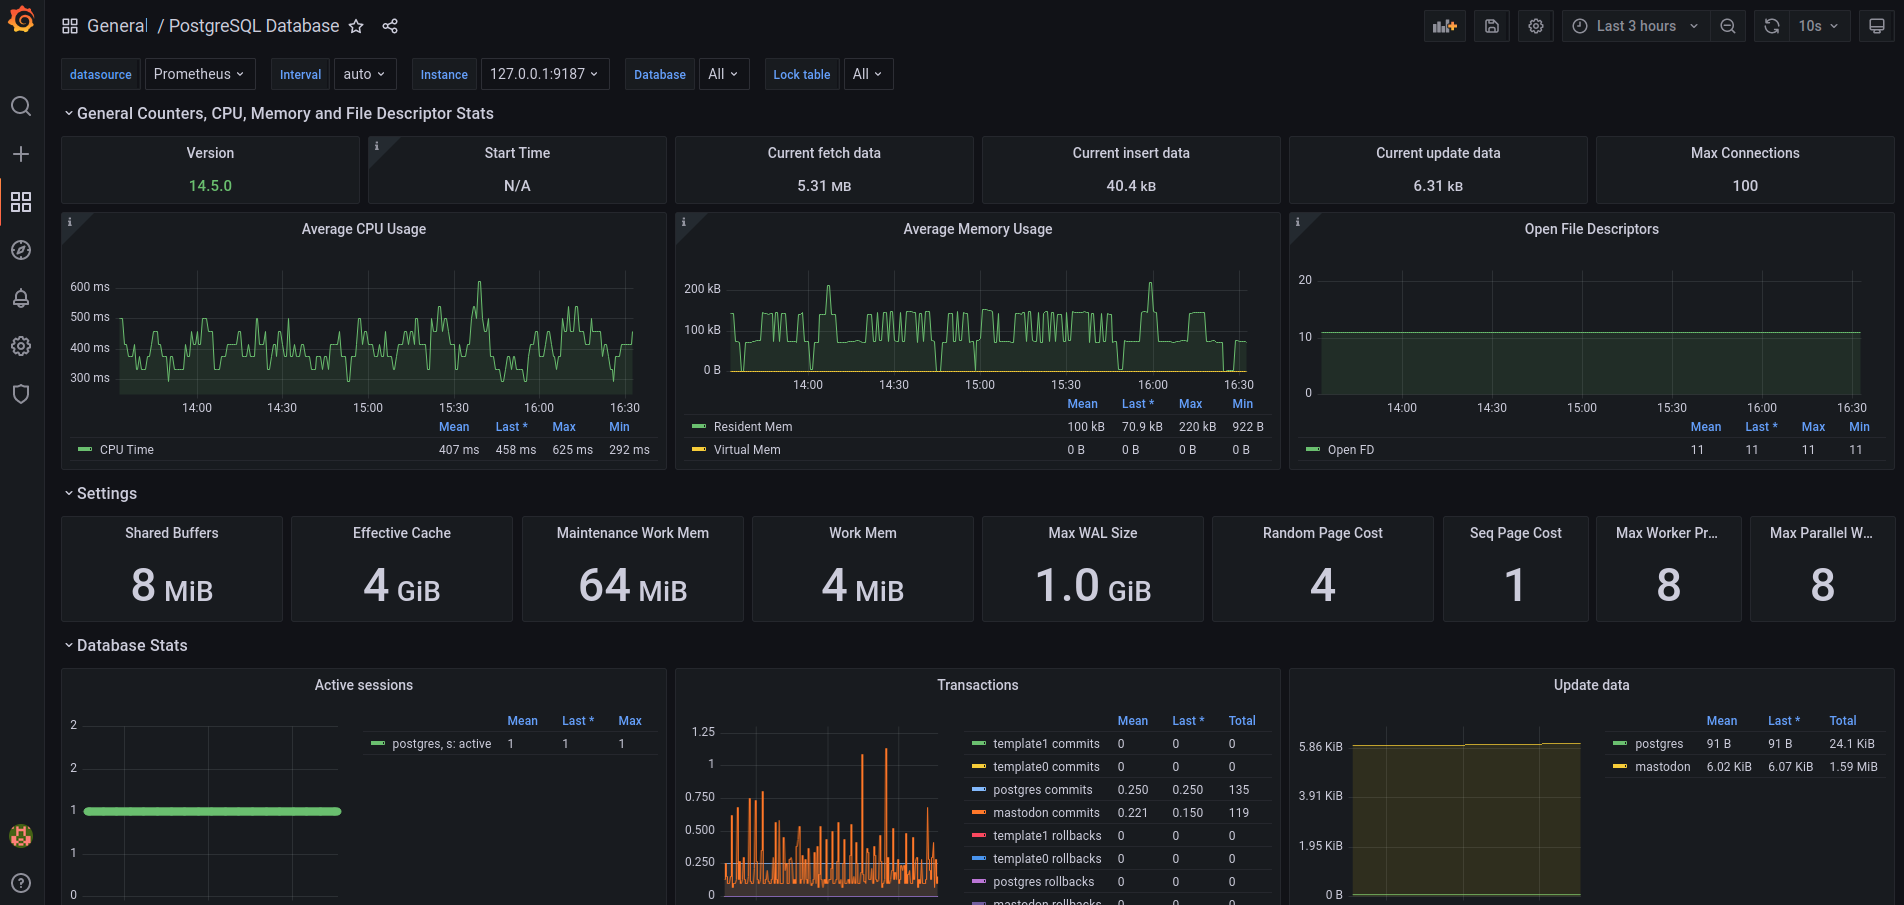
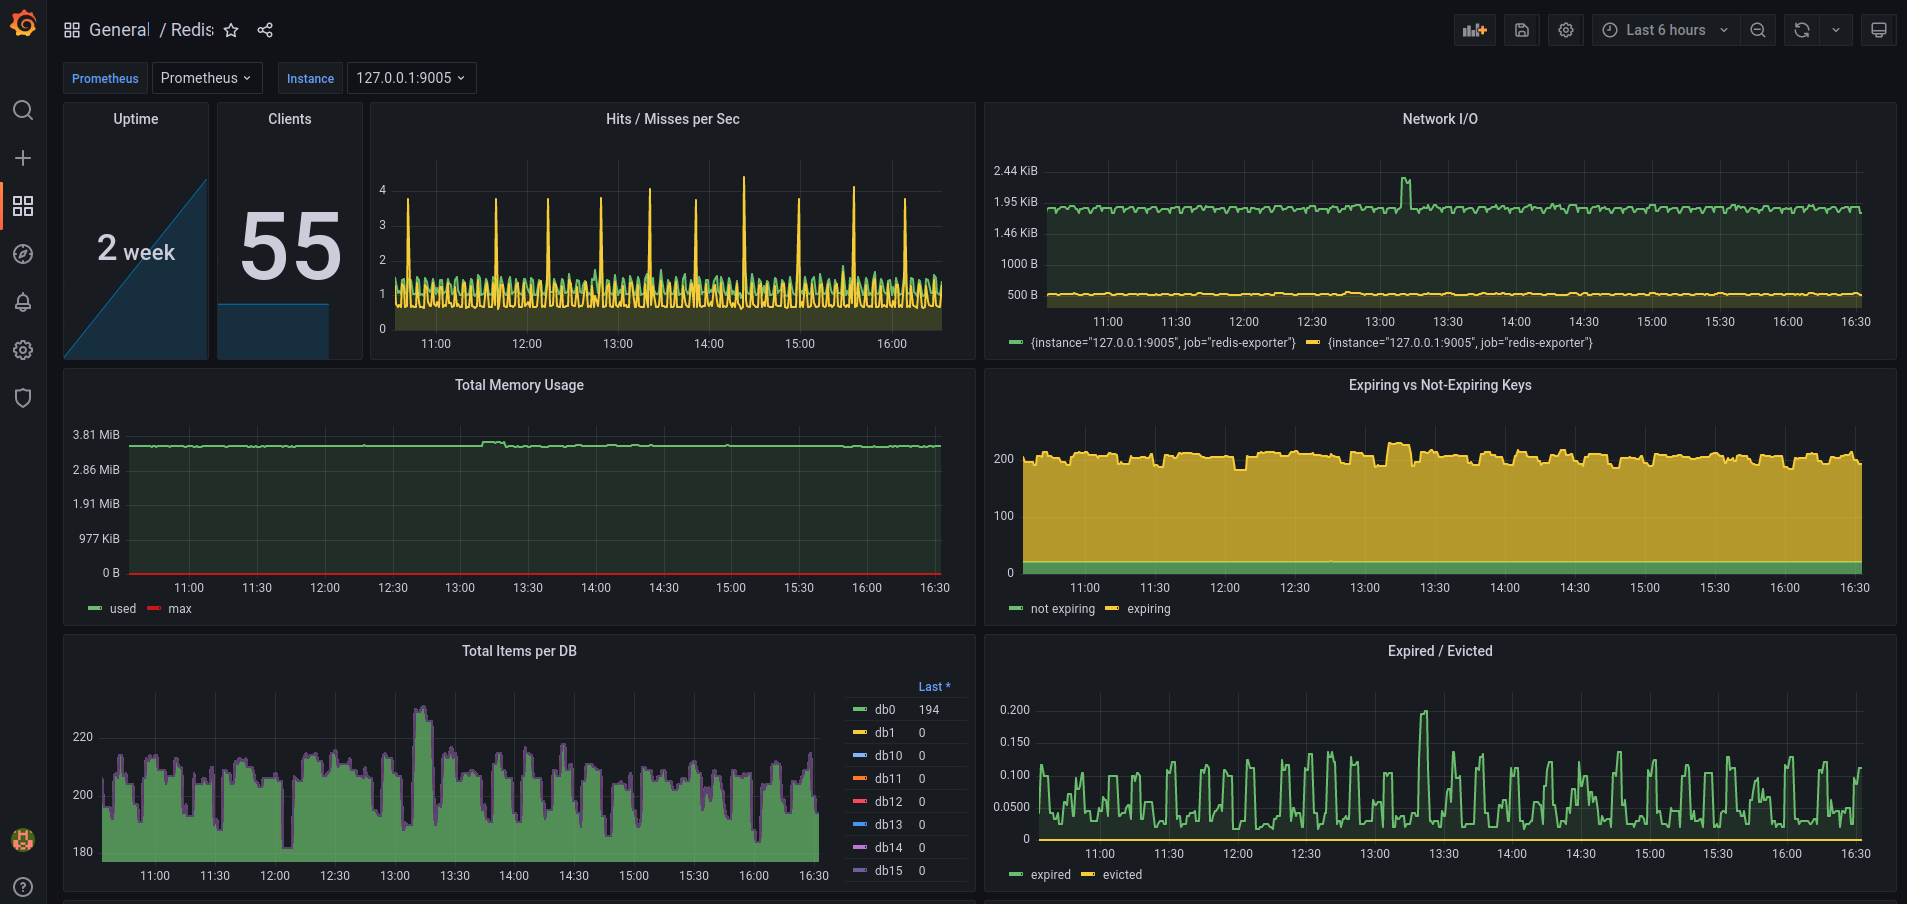
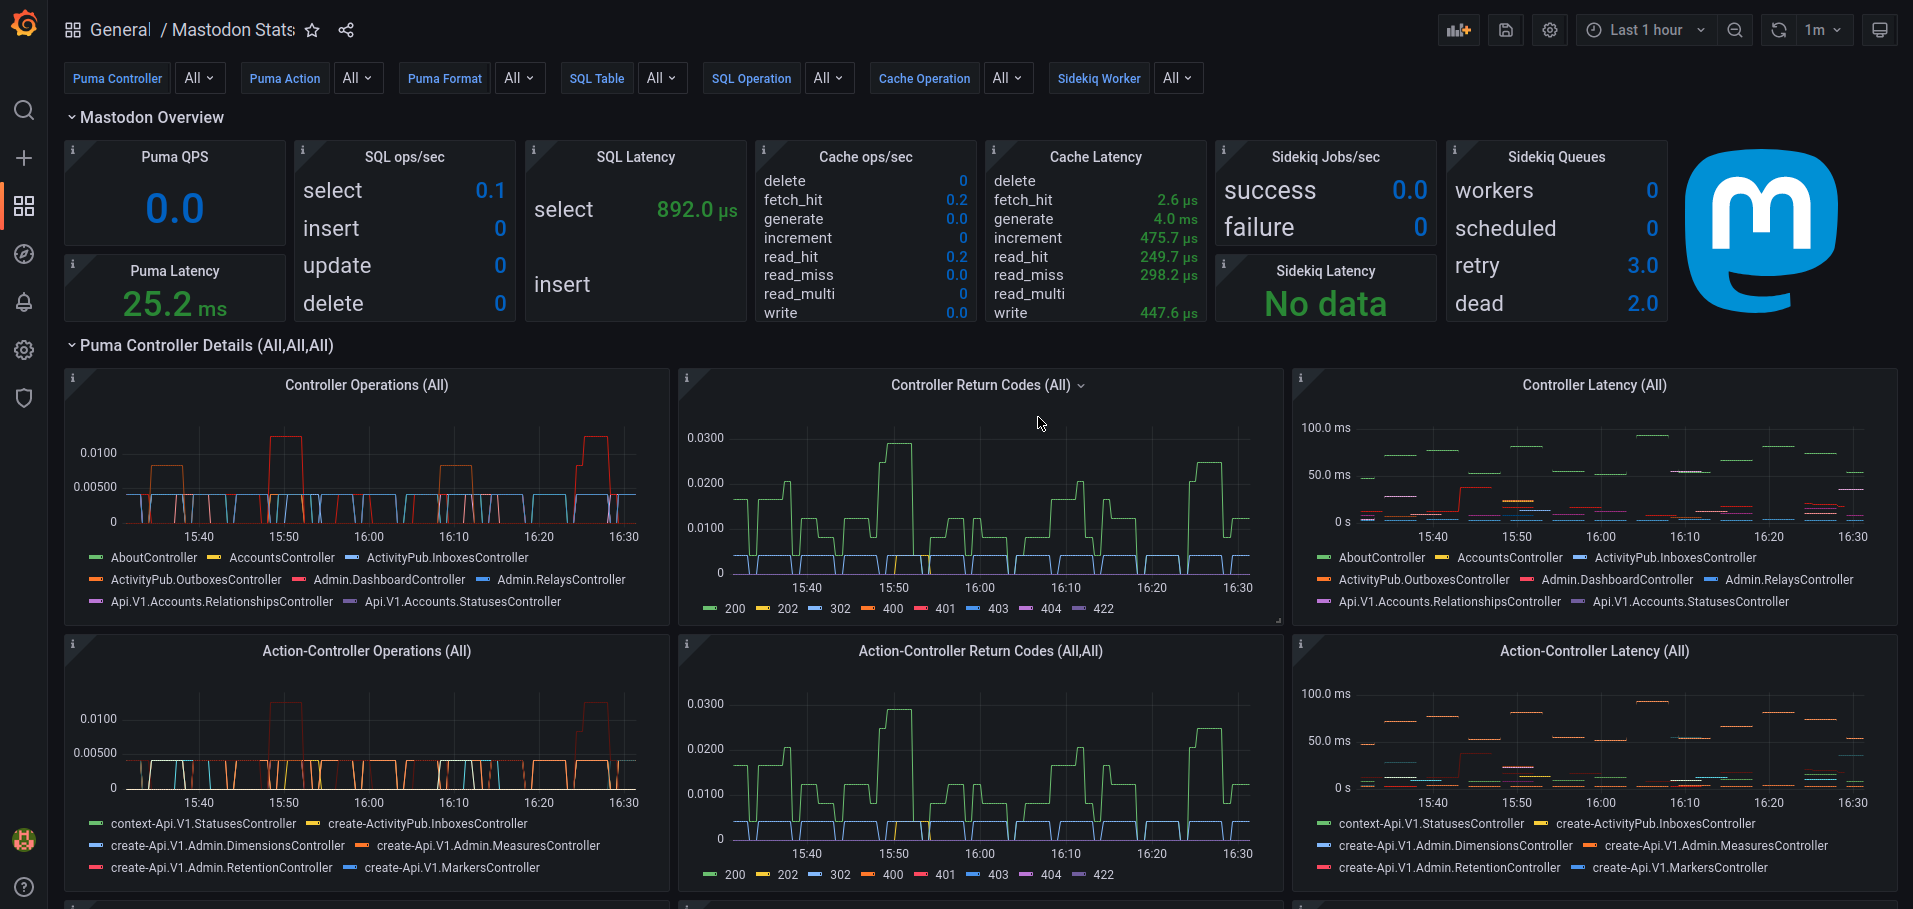
I have access to these dashboards at the moment:
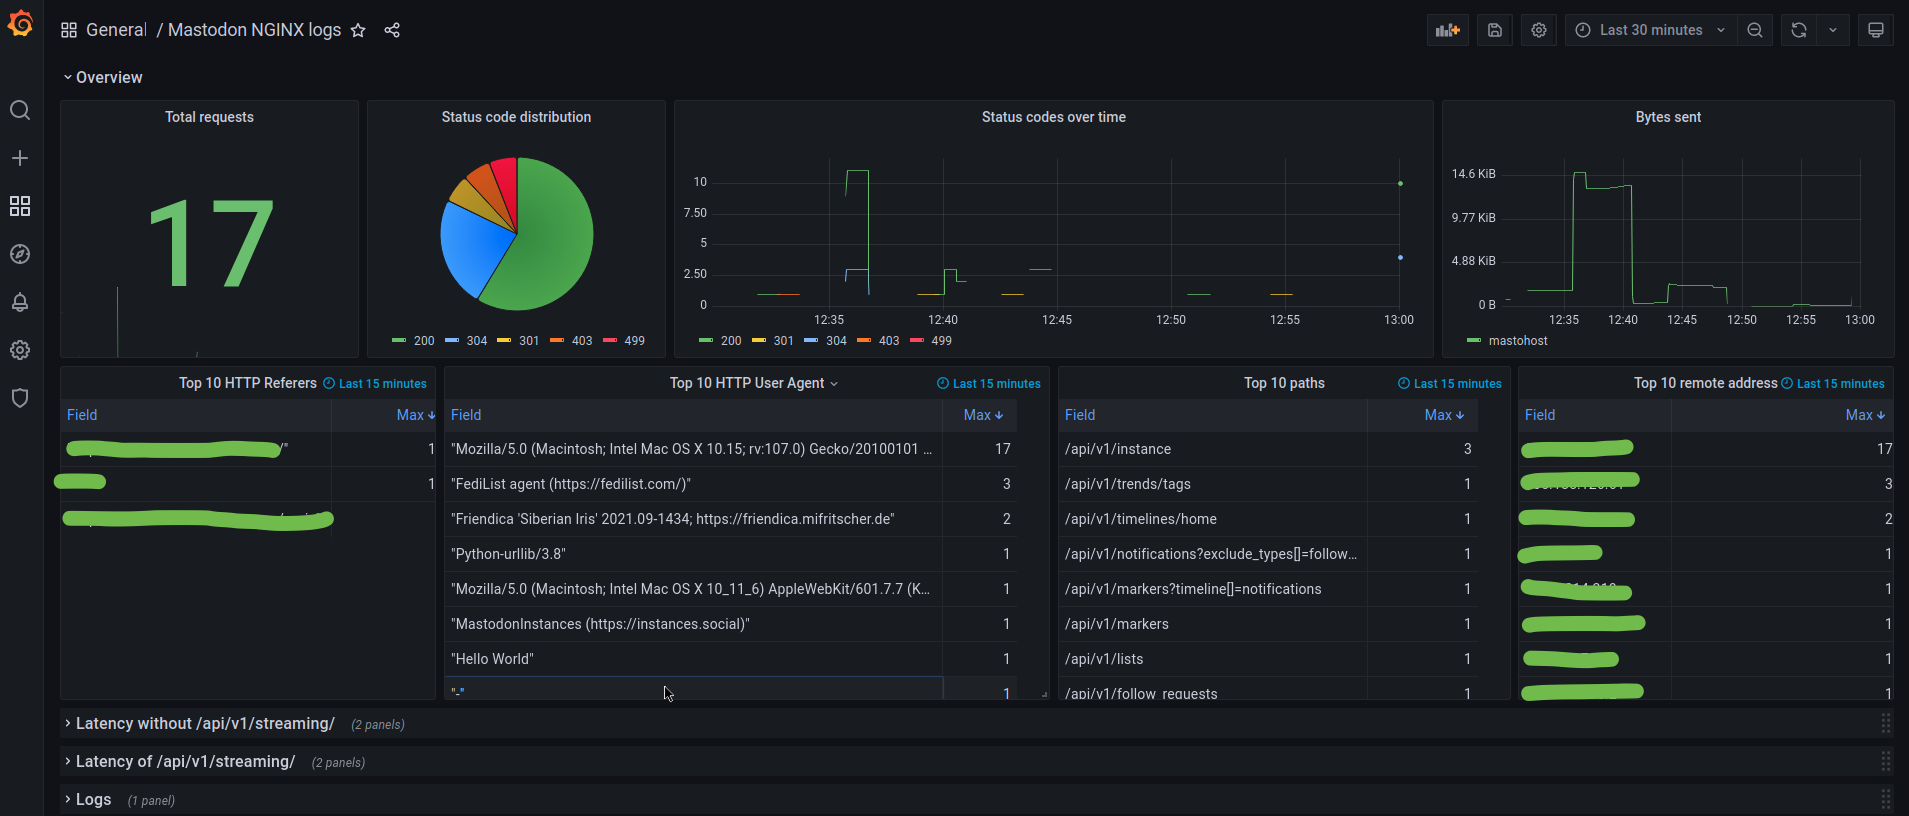
What’s next?
What I currently have is a solid baseline that I can start to build upon.
I have the following TODO items to make all this a bit more production ready:
- decide on a tool to deploy and manage NixOS, and potentially reorg the code into smaller modules
- optimize NGINX for performance
- get more data out of the raw logs with Loki to have log based metrics/alerts
- create the Operational Dashboard that covers everything with drill down option to service logs
- add all the existing mixins
- perform a Mastodon upgrade and observe how the system behaves
- harden NixOS itself
- run a security audit
After all these in place, I can start thinking about moving to my instance and even hosting a few other people as well. I am not sure I will do that as I am satisfied with hachyderm.io at the moment, and it would be a bit lonely being on my own on a somewhat empty server. Especially after seeing how good the Local Timeline is for hachyderm.io.
I will see how I will proceed with this project, but it was fun to put all this together and learn a bit of NixOS along the way.
On Mastodon’s side, I am looking forward to experiment with this, to have control over the sidekiq processes per systemd units, and looking into performing zero downtime upgrades.
Once I have the dashboard, I am planning to open-source that so other admins can use it for their own instances if needed. Following the life of toots across the system, upgrading Mastodon, or similar operations would be a good candidates to confirm the usefulness of such a dashboard.